

Freddie Mac recently released its Apartment Investment Market Index (AIMI) for Q2 2024. The national index was up, but only by 0.3 percent in the quarter. The index was up 2.2 percent year-over-year.
Viewing the trends
For those unfamiliar with Freddie Mac’s AIMI, please see “Defining AIMI” below. Note that falling property values lead to a higher AIMI, so a higher AIMI is a signal that it a better time to make a new investment in multifamily property. It does not necessarily mean that conditions are improving for current multifamily property owners. However, falling interest rates and rising rental income will also result in a higher AIMI and these are good for both owners and buyers of multifamily property.
The national AIMI since 1Q 2000 is shown in the first chart, below.
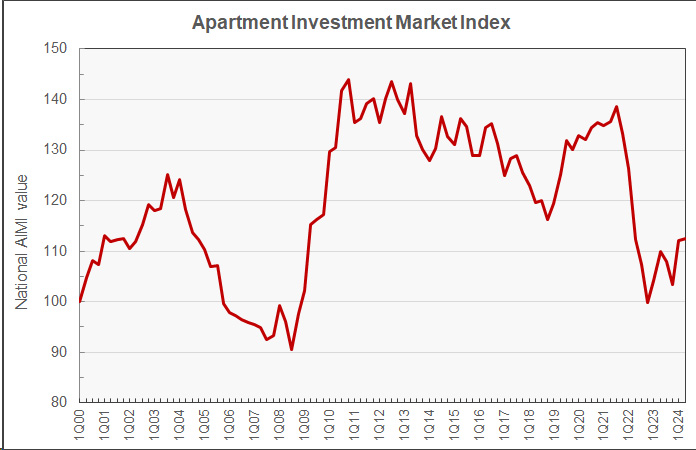
The chart shows the AIMI, at 112.4, is at its highest level since Q2 2022. However, it is still well below its level in the 2010 to 2020 time frame. It averaged 132.2 over that 11 year time span.
Looking at the constituent parts of the AIMI, the interest rate in Q2 is 6.14 percent, up from 5.93 percent last quarter and 5.50 percent one year ago. The rental income index is up 1.2 percent from the prior quarter but up only 0.43 percent year-over-year. The property value index is down 1.38 percent quarter-over-quarter and down 8.31 percent from its year-ago level.
The following table shows the quarterly, annual and 5-year percentage changes for the AIMI in the cities tracked by Freddie Mac.
| Location | 1 Quarter AIMI change (percent) | 1 Year AIMI change (percent) | 5 Year AIMI change (percent) |
| District of Columbia | 2.23 | 10.22 | (8.13) |
| Portland | 1.71 | 1.27 | (9.14) |
| San Diego | 1.71 | 1.23 | (7.65) |
| Dallas | 1.38 | 0.90 | (17.24) |
| Houston | 1.15 | 8.10 | (0.55) |
| Miami | 0.90 | (1.57) | (8.92) |
| Tampa | 0.57 | 7.37 | (11.39) |
| Jacksonville | 0.52 | 0.56 | (18.53) |
| Minneapolis | 0.40 | 2.70 | (9.84) |
| San Francisco | 0.35 | 5.66 | (12.00) |
| Seattle | 0.35 | 7.86 | (2.91) |
| National | 0.33 | 2.18 | (10.23) |
| Chicago | 0.25 | (1.12) | 0.90 |
| Denver | 0.23 | 8.21 | (12.72) |
| Orlando | 0.18 | (1.57) | (17.12) |
| Atlanta | 0.07 | 0.08 | (21.45) |
| Oakland | 0.01 | 3.58 | (7.73) |
| Nashville | (0.26) | (2.38) | (23.29) |
| Los Angeles | (0.47) | (1.04) | (2.33) |
| Las Vegas | (0.53) | (0.99) | (27.53) |
| Philadelphia | (0.90) | (0.85) | (4.25) |
| New York | (0.98) | (1.38) | 18.06 |
| Phoenix | (0.99) | 2.21 | (28.52) |
| Boston | (1.47) | (0.59) | (17.25) |
| Charlotte | (2.11) | (4.70) | (23.44) |
| Raleigh | (2.67) | 2.42 | (21.04) |
The property value component of the AIMI fell 1.4 percent quarter-over-quarter nationally. Property values declined in all but 5 of the 25 metros tracked by Freddie Mac. Metros with property value growth since Q1 included Boston (0.65 percent), Philadelphia (0.31 percent), Raleigh (0.21 percent), Charlotte (0.20 percent) and Las Vegas (0.09 percent). Metros with the greatest property value declines since Q1 included Dallas (-3.64 percent), Jacksonville (-2.91 percent), Houston (-2.78 percent) and Tampa (-2.68 percent).
The rental income component of the AIMI rose 1.20 percent quarter-over-quarter nationally. Rental income fell in only 3 of the 25 metros tracked by Freddie Mac. Metros with the greatest increases in rental incomes since Q1 included Portland (2.11 percent), Washington D.C. (2.10 percent), Chicago (1.88 percent) and Seattle (1.86 percent). Metros with declines in rental incomes since Q1 included Raleigh (-0.25 percent), Jacksonville (-0.18 percent) and Dallas (-0.09 percent).
Defining AIMI
Freddie Mac developed the AIMI as a quick way to assess the changing attractiveness of investing in multifamily properties in a given market over time. It is derived from three market variables: the interest rate on multifamily mortgages, the growth rate in multifamily property prices and the growth rate in multifamily net operating income (NOI). The higher the value of the AIMI, the more attractive an investment in multifamily property is said to be. Higher growth in NOI results in a higher AIMI while higher multifamily mortgage interest rates or higher growth rates in multifamily property prices result in a lower AIMI.
Each quarter, Freddie Mac calculates a national AIMI and also local AIMI’s for 25 top metro areas. Since the AIMI for each metro area is normalized to a value of 100 for Q1 2000, the absolute value of the AIMI for the different metros cannot be used as a measure of the comparative attractiveness of investments in multifamily housing between the metros. This is because the market conditions in each of the metros in Q1 2000 were different, so each metro’s AIMI is calculated relative to a different baseline. However, the changes in the levels of the AIMI for any given metro are an indication of whether investment conditions are improving in that metro.


