

CoStar reported that its value-weighted index of multifamily property prices fell 1.3 percent month-over-month in August, doubling last month’s reported decline. This index was down 9.8 percent year-over-year.
The value-weighted index of non-multifamily commercial property rose 1.3 percent month-over-month in August. This index is down 11.5 percent year-over-year. The other commercial property types tracked by CoStar are office, retail, industrial and hospitality.
For more information on the CoStar Commercial Repeat Sales Indexes (CCRSI’s), please see the description at the bottom of this report.
Multifamily property prices resume decline
The first chart, below, shows the history of the value-weighted CCRSI’s since January 2016 for multifamily property and for all other commercial property considered as a single asset class. It also shows trend lines for the growth in the two CCRSI’s based on their growth in the period from January 2012 to January 2020. The indexes are normalized so that their values in December 2000 are set to 100.
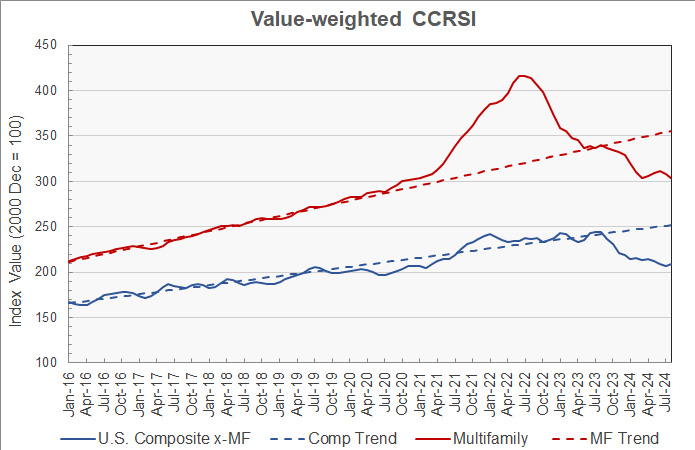
The chart shows that multifamily property prices have resumed a downward trend after seeming to be on the rise this spring. Prices are now effectively where they were in March, before their recent rise. Multifamily property prices are down 26.9 percent from the high they reached in July 2022. They are 14.6 percent below their pre-pandemic trend.
Prices for other commercial property types rose this month after three months of declines. These prices are now 14.4 percent below their high point and 17.0 percent below their pre-pandemic trend.
The second chart shows the recent history of multifamily property prices and other commercial property prices based on this month’s data along with the estimates from last month. For purposes of this chart, the price indexes for both property groupings were set to a value of 100 in January 2020 so that the indexes could be plotted together at a scale that would show the detailed price movements.
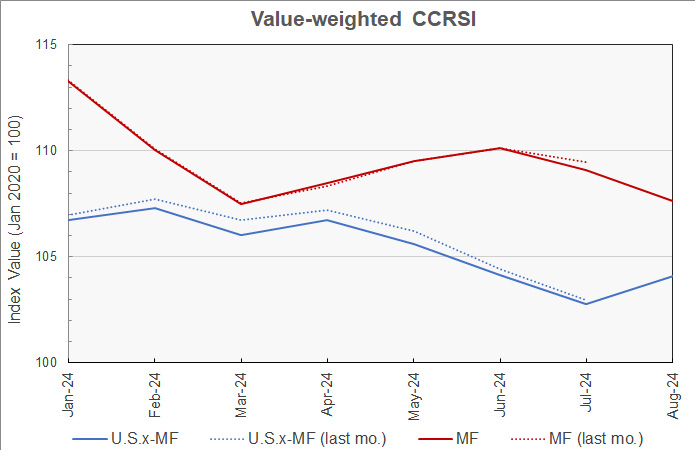
The chart shows that new multifamily transactions added to the dataset only made a noticeable change to July’s index value, with a 0.4 percent decline from the value reported last month. However, revisions to the commercial property price dataset made noticeable changes to the results over the entire time span shown. The result being that price declines were slightly larger than previously reported.
Transaction volumes reported higher
An issue with monthly transaction volume reporting is that CoStar usually identifies additional transactions to tabulate over the next few months after the initial report, and these extra transactions tend to make initial reports of rising transaction volumes appear less positive than they will subsequently appear. For example, CoStar reported that the transaction volume in August was down 5.7 percent from the revised level of the month before. However, it was up 7.6 percent from the preliminary level for July reported last month.
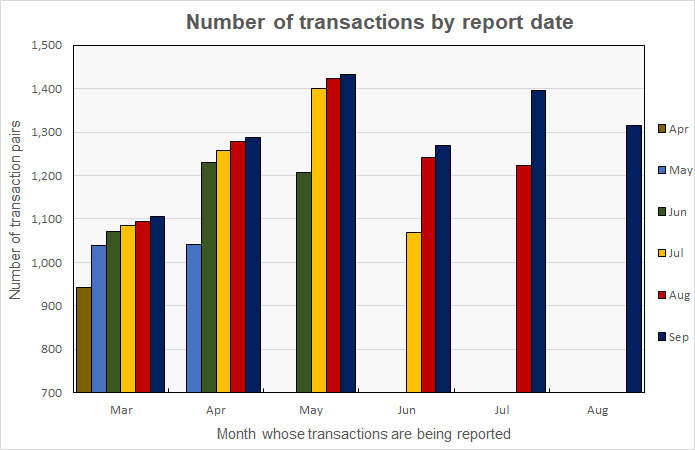
CoStar reported that their initial transaction count for August was 1,315 repeat sales pairs. This is up from the 1,222 transaction pairs identified for July in last month’s report but down from the 1,395 transaction pairs identified for July in this month’s report.
The history of the revisions to the transaction counts for recent months is illustrated in the next chart. It shows that the number of transactions for March was initially given in the April report and has been revised upward in every subsequent report. The size of the transaction count revision was largest in the next month’s report but additional transaction pairs for March continued to be identified in every subsequent report. On the other hand, transaction data for August only appears in the September report and we can expect it to be revised next month.
The preliminary dollar volume of transactions was reported to rise 3.2 percent from the revised level of the month before to $9.31 billion. The increase from the preliminary level reported last month was 19.2 percent.
The full report discusses all commercial property types. While the CoStar report provides information on transaction volumes, it does not break out multifamily transactions. The latest CoStar report can be found here.
CCRSI defined
The CoStar report focuses on a relative measure of property prices called the CoStar Commercial Repeat Sales Index (CCRSI). The index is computed based on the resale of properties whose earlier sales prices and sales dates are known. The index represents the relative change in the price of property over time rather than its absolute price. CoStar identified 1,315 repeat sale pairs in August for all property types. These sales pairs were used to calculate the results quoted here.
CoStar computes CCRSI’s for a variety of property groupings, combining them by cost, region, property type or other factors. The value-weighted index is more heavily influenced by transactions of expensive properties than is CoStar’s equal-weighted index. The value-weighted index is the focus of this report because it is an index whose value is reported monthly and for which CoStar breaks out multifamily property as a separate category.


