

Yardi Matrix recently announced focused coverage of the affordable housing market. As part of that coverage, they released a study showing wide variation in how affordable housing rents compare to market rate rents in different markets.
Assessing the data
To estimate average rents for affordable housing, Yardi Matrix looked at their database of 11,000 privately owned fully affordable properties and assessed the maximum allowable rent for the units. Yardi Matrix defines a “fully affordable” property as one where at least 90 percent of the units have income restrictions on their residents.
Market rate rents were evaluated for four tiers of property quality. Yardi Matrix defined them as Discretionary (A+, A), Upper Mid-range (A-, B+), Low Mid-range (B, B-) and Workforce-upper (C+,C). They calculated the average rent level and the share of total unit stock for each tier.
Yardi Matrix then calculated what level of income as a percentage of Area Median Income (AMI) would be required to afford each property tier. Affordability is based on the unit’s rent not exceeding 30 percent of household income. They compared the necessary income level to afford each quality tier to that of the affordable units to assess whether the units in that quality tier are competitive with the affordable units.
The results of the study are summarized in the following chart, which is taken from the report. It shows the portion of market rate units in each metro whose rents are competitive with those of affordable units in the same metro.
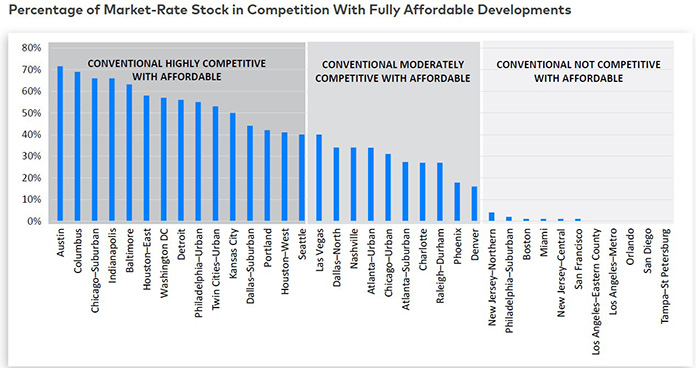
The chart shows the wide range of competitiveness results. In Austin, fully 71 percent of market rate rental housing stock is competitive with the average local affordable unit. However, there are a number of metros where none of the tiers of market rate properties are competitive with the average affordable unit in that metro.
Why is that?
The report identifies key market characteristics that correlate with market rate competitiveness. Market rate units in metros with very high average rents tend not to be competitive with affordable units. However, metros with high levels of new supply tend to have a higher level of market rate units that can compete with affordable units. Metros with a high portion of their stock in the lower two quality tiers also have a higher portion of their market rate units competitive with affordable units.
The full report has detailed information on 6 metros, Austin, Boston, Columbus, Orange County, Orlando and St. Louis. It is available here.


