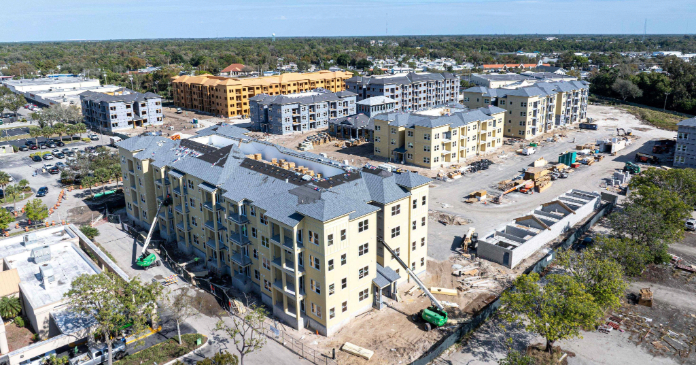
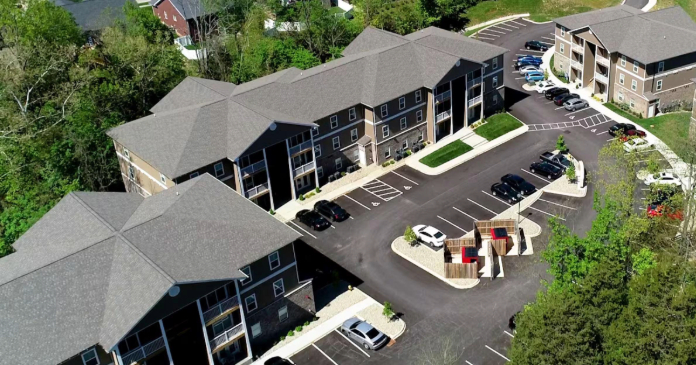
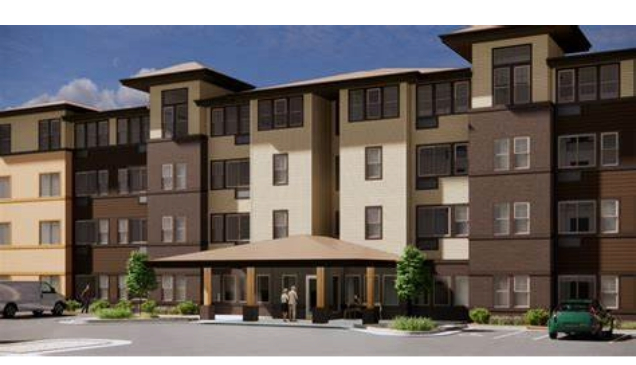
On December 3, Yardi Matrix released its first-ever report on expense and income growth in the affordable housing sector. The report concludes that expenses and income have grown in tandem at above-level rates in the sector this year, with insurance premiums leading the expense pack. The report uses numbers from Matrix’s new affordable housing database to examine affordable housing performance and trends that will impact the sector’s future.
All sectors of multifamily logged expense growth over the past several years, but they are more impactful for affordable housing properties since operators typically are prevented by rent caps from raising rents to defray major new costs.
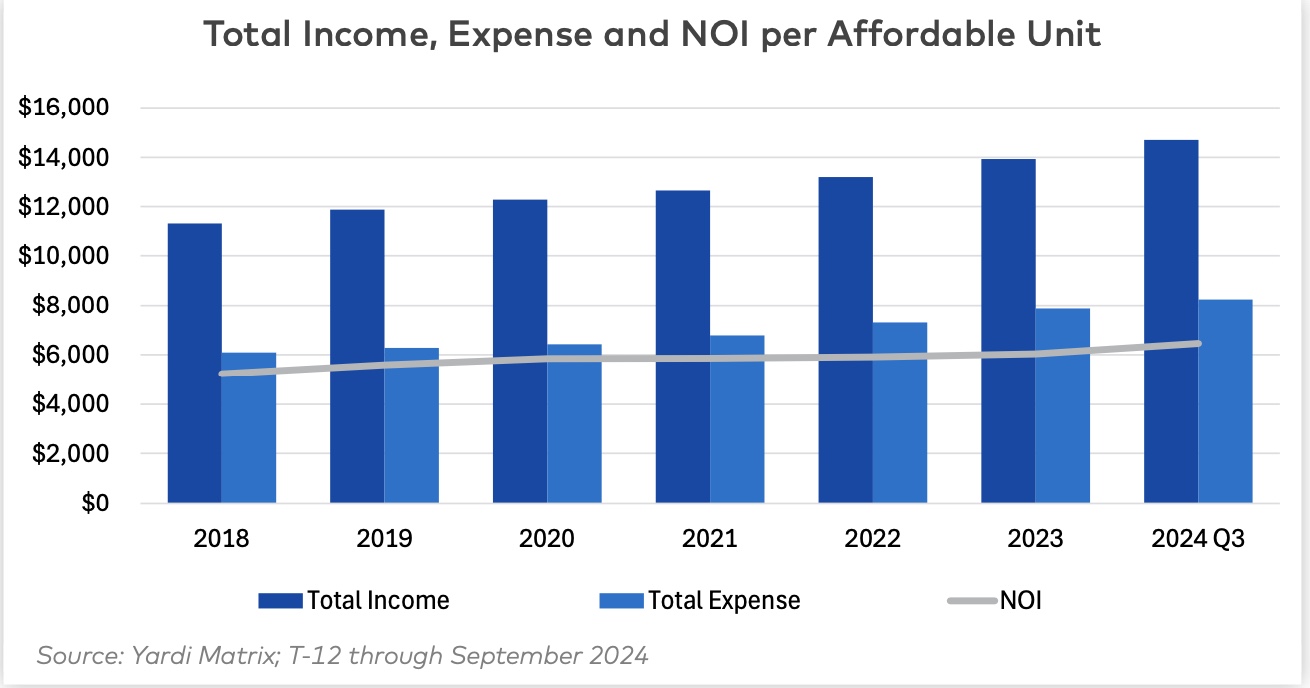
The national average expense per unit for affordable multifamily properties was $8,243, up $499, or 6.4 percent year-over-year at the end of Q3 2024, less than the prior two years but more than the three- to four-percent expense growth typical for the sector.
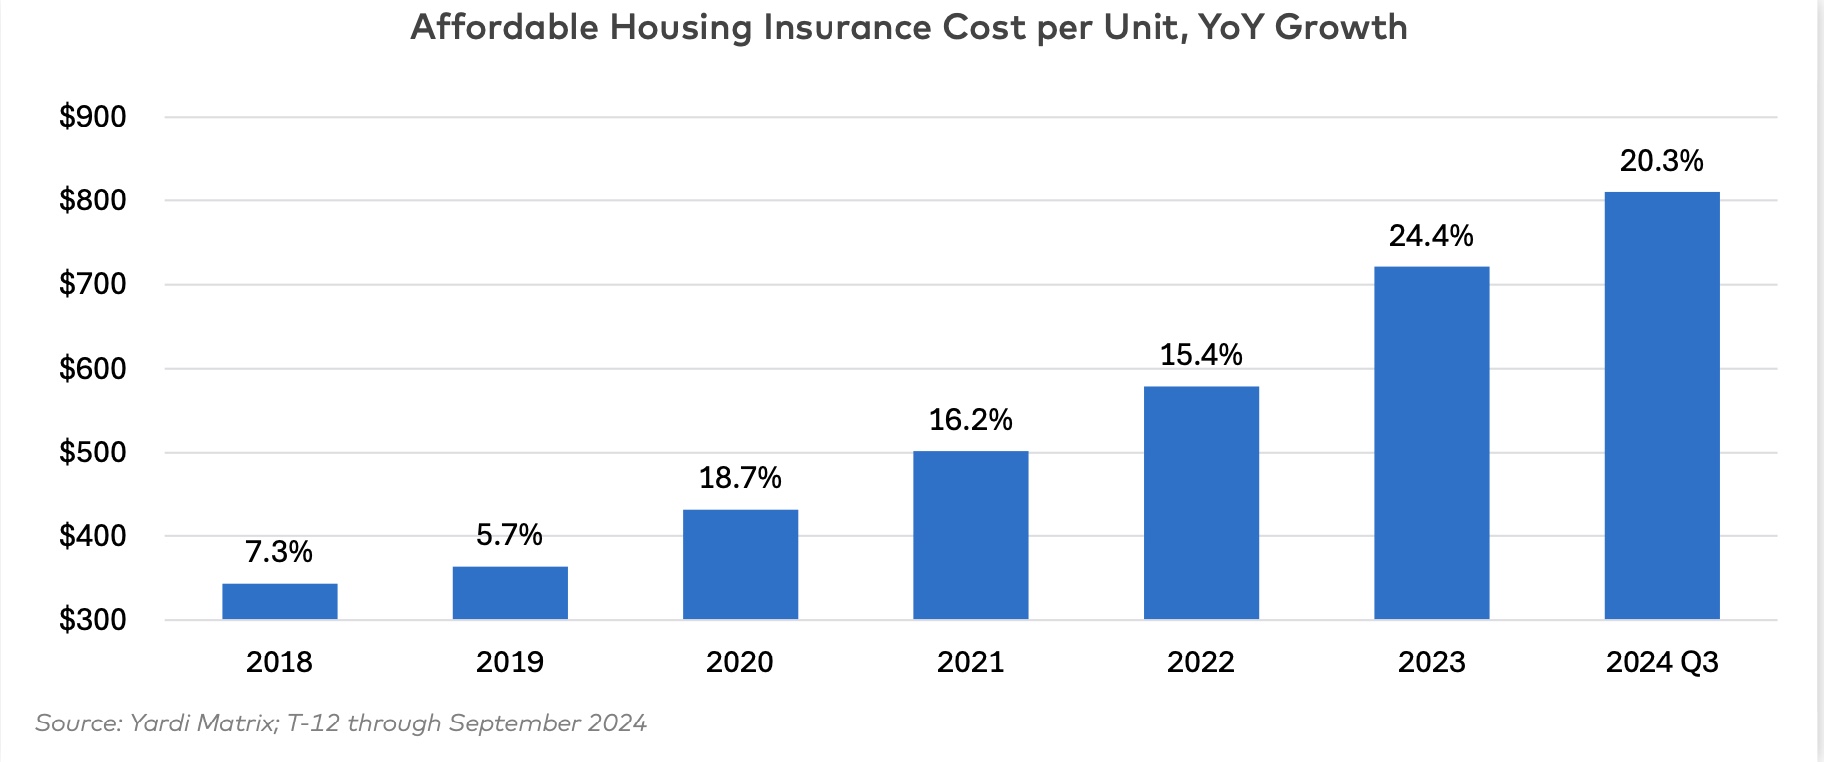
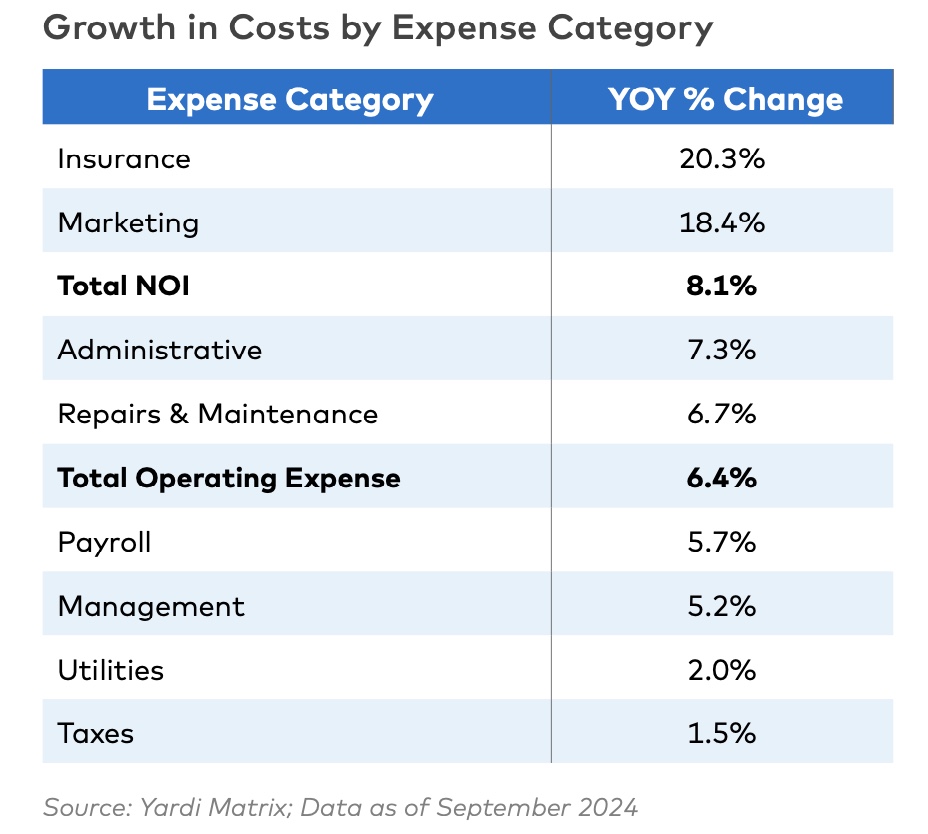
As a share of total expenses, insurance rose to 9.8 percent as of 3Q 2024, up from 5.6 percent in 2018, and are the largest driver of higher expenses this year.
Major weather-related events caused claims to balloon over the past five years and insurance costs to increase by at least 15 percent, with the Southeast, Southwest and the West, respectively, being subject to the greatest number of damage events and the highest growth in insurance-related expenses. The following graph shows growth of insurance costs per unit in affordable housing properties since 2018.
Other expenses include labor and materials costs, and incidental items such as marketing costs, which can be partially traced to the robust multifamily supply pipeline and the need for property owners to attract tenants as the amount of available stock grows in high-supply markets.
Labor costs also have increased in the tight job market as employers pay more to attract and retain managers and other employees, says Matrix.
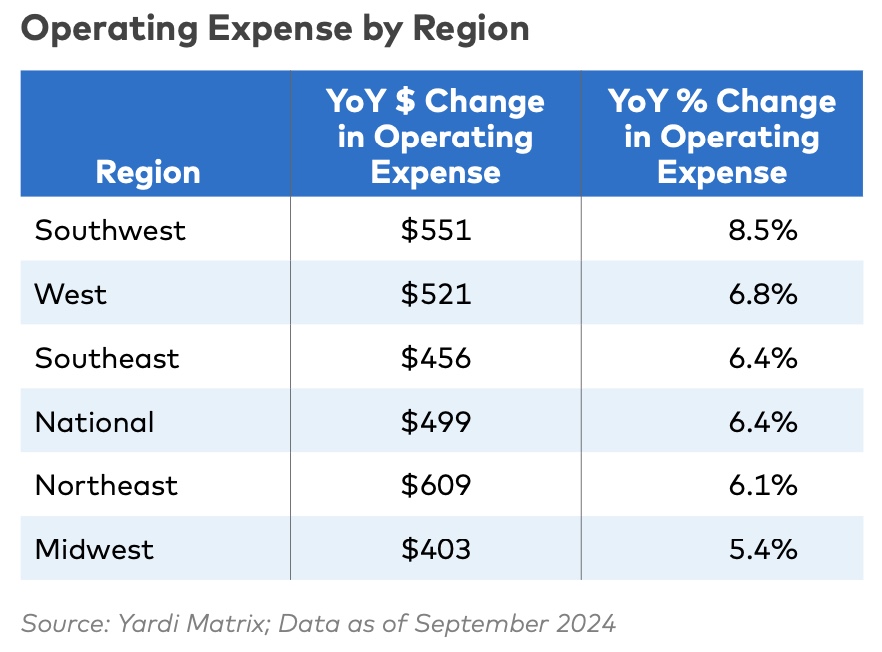
Growth in expenses at affordable housing properties is not distributed evenly across the country, said Matrix. Markets with the highest average expenses at affordable properties include New York, Boston and San Francisco, while the lowest average expenses are in Orlando, Las Vegas and San Antonio. The graph below highlights the changes in operating expenses by region.
The good news is that revenue has moved together with expense growth at affordable properties, enabling the sector to post increases in net operating income (NOI) over the past year.
Rent growth for affordable housing is subject to limits set annually by the federal Department of Housing and Urban Development (HUD) using formulas that allow rent increases based on the greater of five percent annually or two times the inflation rate.
Because that rate dropped below two percent in 2012 and remained there for the most part until the pandemic hit in 2020, the maximum rent increase has been fairly restrained and stable for most of the last decade, said Matrix.
The formula that governs rent growth allows for higher increases when inflation and wage growth in the economy are high. The bad news is that expenses generally eat up a higher percentage of income in affordable properties than market-rate assets and, since the pandemic eviction bans went into place, more residents in affordable properties have failed to pay rent on time, said Matrix.
The combination of inflation and moderating wage growth in the economy may put a damper on future NOI growth. “Without getting a handle on expenses, owners may find their properties’ NOI shrinking,” warns Matrix.
The full report is available here.


