

Housing affordability has emerged as a key issue in this year’s U.S. presidential election. Both Democrat Kamala Harris and Republican Donald Trump have talked about what they would do to increase the supply of affordable homes and people’s ability to buy them, though their plans have little in common.
It’s an important issue for the public, too: In a recent Pew Research Center survey, 69 percent of Americans said they were “very concerned” about the cost of housing, up from 61 percent in April 2023.
 Local influences on affordability
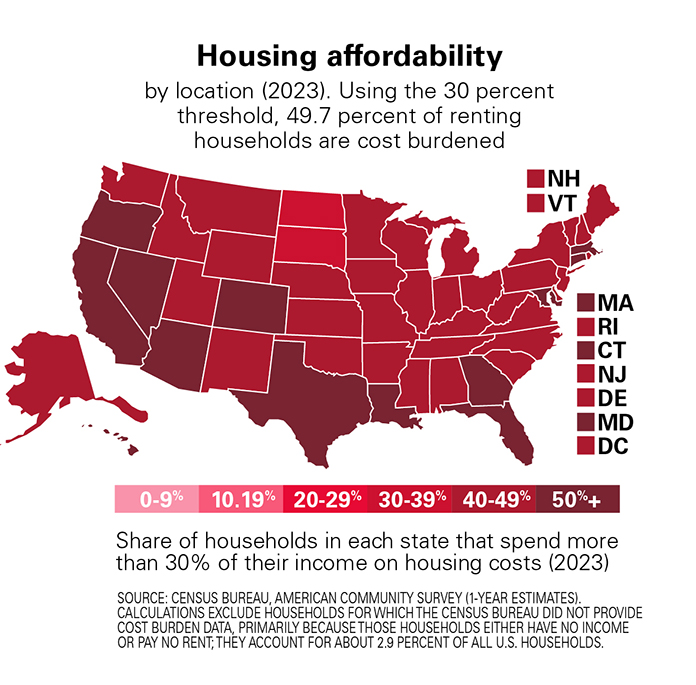
The tipping point on affordability is thought to be renters who spend 30 percent or more of their income on gross rent. In 2023, about half (51.8 percent) of renting households paid that much in gross rent, American Community Survey (ACS) estimates show. The share of renters reaching that threshold hovered around 50 percent for the entire 2011-2023 period.
Like much else involving real estate, location, location, location plays a key role in how housing cost burden is distributed. That’s especially true in Calif., according to 2023 ACS estimates.
The federal government identifies more than 900 metropolitan areas in the U.S. based on the population of an area’s core city or town. Many of the metros with the highest shares of cost-burdened households (i.e., those that spend more than 30 percent of their income on housing costs) are in Calif..
Smaller micro- and metro- areas, as well as largely rural states, generally tend to have lower shares of cost-burdened households. Looking at the areas where the smallest shares of households spend more than 30 percent on housing, most have populations smaller than 250,000, and the majority are located in Wisconsin, Alabama or North Carolina.
Some states have especially high shares of households spending more than 30 percent of their income on housing. For example, 40.6 percent of California households meet this threshold—including more than half (54.1 percent) of renters. Roughly similar shares of households in Hawaii (38.2 percent) and Florida (37.2 percent) also spend this much on housing, according to 2023 ACS estimates.
At the other end of the spectrum, much smaller shares of households meet the cost burdened threshold in West Virginia (21.0 percent of households), North Dakota (22.0 percent), South Dakota and Iowa (23.6 percent each).
In every state, a greater share of renting households than homeowning ones are cost burdened when it comes to their housing costs. And homeowning households that carry a mortgage are more likely to be cost burdened than those that don’t.
At the same time, the Federal Housing Finance Agency’s state-level house price indices have increased for every U.S. state and the District of Columbia, by anywhere from 22.6 percent (D.C.) to 82.3 percent (Maine) between Q2 of 2019 and 2024. Among the nation’s 100 largest metro areas, Miami-Miami Beach-Kendall in Fla. had the biggest five-year increase: 95.0 percent.
Contributors to affordability
A lack of housing affordability is the product of multiple factors intersecting in sometimes unpredictable ways. Interest rates, new home construction, population growth, population shifts, rising materials prices and rents, disposable incomes, and local economic conditions all affect how easy or difficult it can be to find a home in a desired location.
Multifamily housing may offer some relief. Coming out of the Great Recession, buildings with five or more units were completed at a steadily rising pace until rising significantly in 2023, according to the Census Bureau’s Survey of Construction. That year, 438,300 such privately owned housing buildings were completed, more than in any year since 1987. As of Sept. 2024, completions of buildings with five or more units were running at a seasonally adjusted annual rate of 671,000.


