

The Census Bureau’s quarterly report on home ownership and occupancy for Q4 2024 stated that the rental housing vacancy rate was 6.9 percent. This was unchanged since last quarter’s report despite a slight drop in the number of renter households.
Looking at vacancies
The headline vacancy rate reported by Census is for all rental housing in the country, both single-family and multifamily. Census breaks down this figure in various ways, including by the number of units in the building. The chart, below, illustrates this comparison.
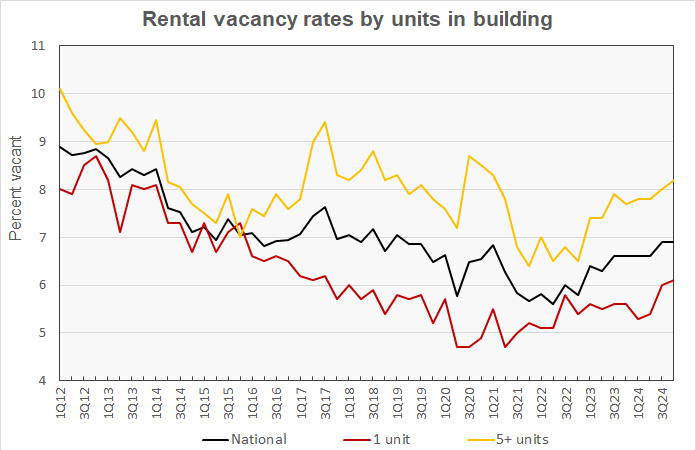
The chart shows that the national housing vacancy rate has been moving higher since early 2022 and that this trend appears both for single-family housing and for multifamily housing with 5+ units per building. Vacancies for multifamily housing with 5+ units per building as measured by the Census Bureau rose 0.2 percentage points to 8.2 percent in Q4. The single-family rental vacancy rose 0.1 percentage point to 6.1 percent.
Note that Apartment List reported that the multifamily rental vacancy rate at the end of December was 6.8 percent. By contrast, Yardi Matrix reported the multifamily rental vacancy rate in December as 5.3 percent. While the Census Bureau attempts to capture data representing all rental housing in the country, other data sources may focus on subsets of the market like professionally managed properties and so they come up with different results.
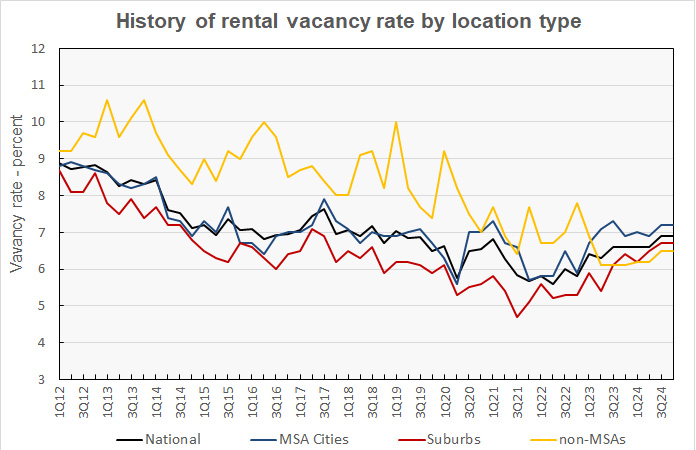
The Census Bureau reported that the rental vacancy rate in the core cities of the Census Bureau’s Metropolitan Statistical Areas (MSAs) was 7.2 percent in Q4 2024, unchanged from the value reported for the previous quarter. The rental vacancy rate in the suburbs of the MSAs was 6.7 percent in Q4 2024, also unchanged. These trends are shown in the next chart, below.
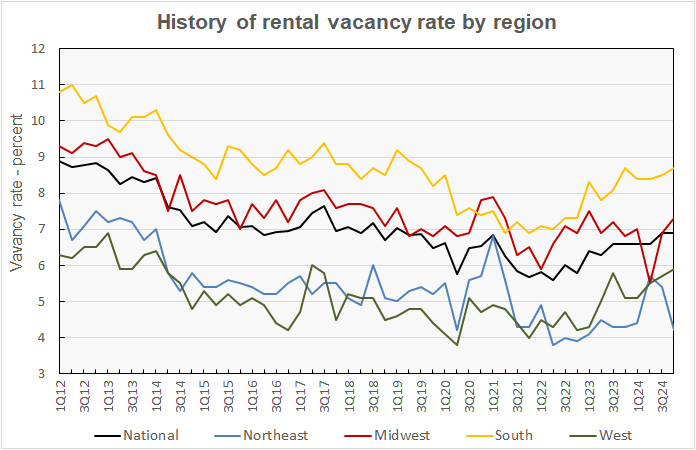
The rental vacancy rate history for each of the Census regions is shown in the next chart, below. The reported vacancy rates fell sharply in the Northeast, dropping 1.2 percentage points to 4.2 percent. The vacancy rate was reported to rise 0.4 percentage points to 7.3 percent in the Midwest. The reported vacancy rate rose 0.2 percentage points in the South, reaching 8.7 percent. It rose 0.2 percentage points in the West to a level of 5.9 percent.
Census reported that 62.0 percent of vacant rental units were in structures with 2 or more units. About 24.3 percent of the vacant rental units had 3 or more bedrooms, with 1 bedroom units comprising 34.9 percent and 2 bedroom units comprising 38.9 percent of vacant stock. The median unit vacancy duration for rental properties in Q4 2024 was 2.8 months, up from 2.7 months one year earlier.
Rentership rate down slightly in Q4
The Census Bureau reported that 34.3 percent of the country’s 132,404,000 occupied housing units were inhabited by renter households in Q4 2024. This rate is down 0.1 percentage point from that in Q3.
The history of the number of occupied housing units and the share of renter households since 2012 is shown in the next chart, below. The chart shows that the reported number of renter households fell by 32,000 in the quarter but was up by 477,000 since Q4 2023. There were 45,462,000 renter households identified in Q4 2024.
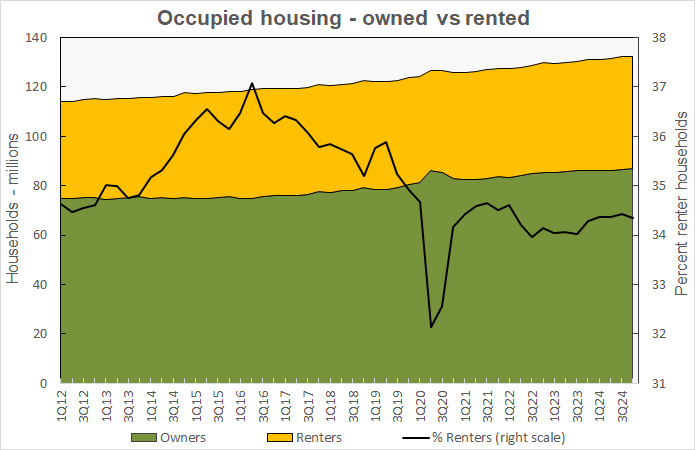
The number of homeowning households rose by 323,000 in the quarter to 86,943,000 households. This was a new all-time high.
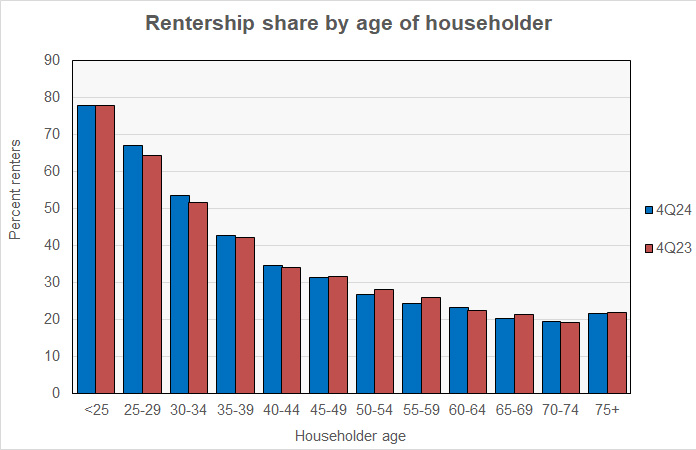
The Census Bureau also reported on the rentership rate by the age of the head of household. The results for the Q4 2024 and for Q4 2023 are illustrated in the next chart. It shows that the share of renter households for age groups under 45 rose over the past year, while the share of renter households fell more often than not for age groups of 45 and older.
Census reports falling rents
The Census Bureau also tracks the median asking rents for the country as-a-whole. The history of their findings along with the year-over-year rent growth rate is shown in the next chart, below.
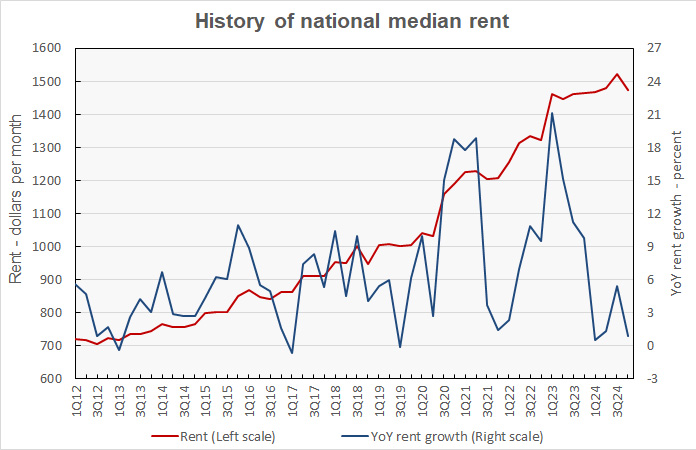
Census reported that monthly rents fell $48 per month in Q4 2024, more than reversing last quarter’s gain. Census reported the national median rent to be $1,475 per month, a fall of 3.2 percent from the prior quarter but a gain of 0.7 percent year-over-year.
By contrast, Yardi Matrix reported that the national average apartment rent in December was $1,742 per month. Apartment List reported the national average apartment rent in December was $1,373 per month.
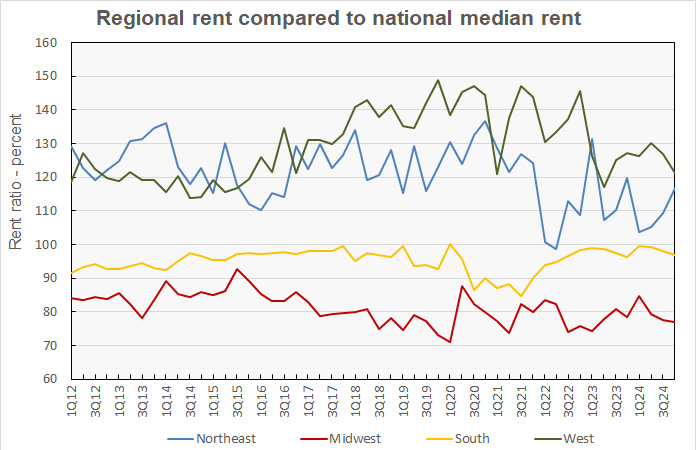
The last chart, below, shows the history of the median rent by Census region as a percentage of the national median rent. Rents were 16.8 percent higher than the national median in the Northeast, and 21.2 percent higher in the West. Rents were reported to be 22.9 percent lower than the national median in the Midwest and 3.2 percent lower in the South.
The Census report is called Quarterly Residential Vacancies and Homeownership, Fourth Quarter 2024. It is available here.


