

Yardi Matrix reported that the national average asking apartment rent was up $3 in January compared to the revised level of the month before at $1,746 per month. The national average year-over-year asking apartment rent growth was +0.8 percent, up 0.2 percentage points from the rate reported last month. The month-over-month rent growth rate was 0.1 percent.
Rents in the “lifestyle” asset class, usually Class A properties, were up 0.1 percent year-over-year, the first clearly positive reading for this asset class since May 2023. Rents in “renter by necessity” (RBN) properties increased by 1.8 percent year-over-year. The lifestyle rent growth is up 0.3 percentage points from last month’s rate while the RBN rent growth is up 0.2 percentage points. The chart, below, shows the history of the year-over-year rent growth rates for these two asset classes along with the difference between these rates.
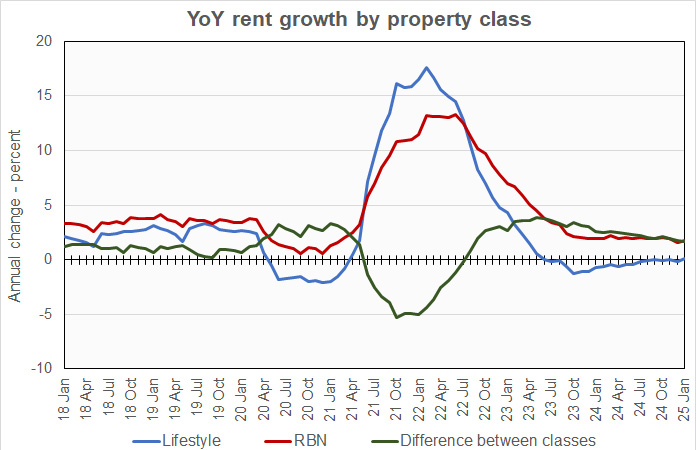
The year-over-year rent growth rates for both lifestyle and RBN both moved in the directions of their 2018 to 2019 averages this month. However, the lifestyle rent growth rate remains 2.4 percentage points below and the RBN rent growth rate remains 1.7 percentage points below those averages, so they still have a long way to go to return to those levels.
Yardi Matrix reported that the U.S. average occupancy rate in December fell 0.2 percentage points from that reported last month to 94.5 percent, a ten-year low.
Taking the pulse of the industry
The discussion section of this month’s report focused on the presentations that took place at NMHC’s recent annual meeting.
Yardi Matrix estimates that 400,000 units were absorbed in 2024 and there is optimism that absorption will remain high in 2025 given continued strong jobs growth and steady economic growth. The slowdown in starts from the levels of two years ago should begin to show up in reduced deliveries, improving operating conditions.
Continuing high interest rates are both a positive and a negative. On the plus side, they have locked homeowners into their homes and have locked first-time home buyers out of the market. This improves apartment retention rates. On the minus side, they make it difficult to achieve positive leverage for property purchasers in today’s cap rate environment. However, meeting participants reported that capital is available, including for construction loans.
The other negative cited is policy uncertainty as market participants assess the impact of the policy shifts initiated by the new administration in Washington.
Tabulating the data
Yardi Matrix reports on other key rental market metrics in addition to rent growth. These include the year-over-year job growth rate based on the 6 month moving average and the completions over the prior 12 months as a percentage of existing stock. The 10 metros with the largest annual apartment rent increases are listed in the table below, along with the other data.
| City | YoY rent | YoY rent last month |
YoY jobs (6 mo moving avg) |
Completions as % of stock |
| New York | 5.4 | 5.0 | 1.7 | 1.5 |
| New Jersey | 4.2 | 3.8 | 1.6 | 2.2 |
| Detroit | 4.1 | 2.5 | 0.4 | 0.6 |
| Kansas City | 3.9 | 3.9 | 1.3 | 2.7 |
| Philadelphia | 3.1 | 1.9 | 1.5 | 1.8 |
| Washington DC | 3.1 | 2.8 | 0.7 | 2.1 |
| Chicago | 2.6 | 3.3 | 0.0 | 1.8 |
| Indianapolis | 2.6 | 2.6 | 2.3 | 2.7 |
| Baltimore | 2.5 | 2.2 | 0.3 | 1.0 |
| Seattle | 2.4 | 1.8 | 0.9 | 4.1 |
The major metros with the smallest year-over-year apartment rent growth as determined by Yardi Matrix are listed in the next table, below, along with the other data as in the table above.
| City | YoY rent | YoY rent last month |
YoY jobs (6 mo moving avg) |
Completions as % of stock |
| Austin | (5.4) | (5.9) | 1.6 | 8.7 |
| Raleigh | (3.5) | (3.1) | 2.4 | 5.9 |
| Phoenix | (2.4) | (2.9) | 2.0 | 5.0 |
| Atlanta | (2.2) | (2.9) | 1.1 | 3.9 |
| Orlando | (2.0) | (2.2) | 1.2 | 5.7 |
| Nashville | (1.9) | (1.6) | 0.7 | 5.7 |
| Dallas | (1.8) | (1.9) | 1.6 | 3.6 |
| Denver | (1.7) | (2.2) | 0.4 | 5.8 |
| Charlotte | (1.3) | (1.4) | 2.1 | 5.4 |
| Tampa | (0.4) | (0.7) | 1.4 | 4.9 |
The top metros for month-over month rent growth in January were Detroit, Houston, Los Angeles and Philadelphia. None of these was in the top 4 in last month’s report. The trailing metros this month were Nashville, Columbus, Raleigh and Boston. Only Raleigh was in the bottom 4 in last month’s report.
Single-family rentals rents also turn higher
Yardi Matrix also reported that single-family rental (SFR) rents rose $5 in January from the revised level of the month before to $2,157 per month. The year-over-year SFR rent growth rate improved to -0.2 percent.
Yardi Matrix reported on the top 34 markets for built-to-rent single-family rentals, 16 of which saw rents grow year-over-year in January. The leading markets for year-over-year rent growth were Kansas City, Detroit, Grand Rapids and Salt Lake City.
The markets with the lowest year-over-year rent growth were Austin, Dallas, Charlotte and Raliegh.
The national occupancy rate for single-family rentals fell 0.3 percentage point from that reported last month to 94.7 percent.
This month, 12 of the metros saw year-over-year occupancy rate increases. The metros with the largest year-over-year occupancy increases were Nashville, Jacksonville, Austin and Chicago. The metros with the greatest occupancy rate declines were Dallas, Greenville, Las Vegas and Cleveland.
The complete Yardi Matrix report provides information on some of the smaller multifamily housing markets and more information on the differences in results between lifestyle and RBN properties. It can be found here.


