

Trepp reported that special servicing rate for multifamily commercial mortgage-backed securities (CMBS) loans resumed its upward trend in February, rising 9 basis points. The overall CMBS special servicing rate on commercial property rose 45 basis points.
Multifamily CMBS special servicing rates resume climb
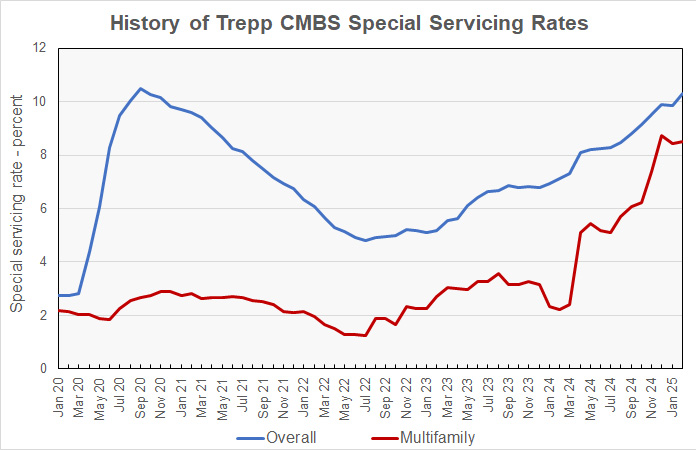
After pausing last month from its recent rapid climb, the special servicing rates on CMBS loans on multifamily property rose to 8.51 percent in February. It was 2.22 percent one year ago.
The report found that overall CMBS special servicing rate rose to 10.32 percent, up from 9.87 percent the month before. This rate has been trending higher for nearly 3 years.
The biggest increase in special servicing rates this month was on that for office properties, which jumped 108 basis points to 16.19 percent. This rate is at a 25-year high.
The special servicing rate on mixed-use properties also rose significantly this month. It climbed another 33 basis points to 13.04 percent. It is up 464 basis points over the last year.
The special servicing rate on CMBS loans on industrial properties fell slightly this month after two months of increases. It fell 5 basis points to 0.61 percent. It was the only property type whose special servicing rate fell for the month.
The rate on lodging properties reversed last month’s decline, rising 14 basis points to 8.31 percent. While it has been relatively stable recently and is at almost the same level as last October, it is up by the largest amount over the last year of the property types tracked by Trepp. It has risen 744 basis points over that time.
The rate for retail properties rose 58 basis points to 11.26 percent.
The history of the overall and multifamily CMBS special servicing rates as reported by Trepp since January 2020 is illustrated in the chart, below.
The full Trepp special servicing rate report can be found here.
Average loan loss falls
Trepp’s report on the volume and severity of loan losses on CMBS loans which were resolved in February showed big drops in the number of loans disposed, in the total loan amount disposed and in the loss incurred per loan.
The report indicated that, of the 7 loans that were resolved for a loss in the month, none of them was exclusively on multifamily property. Three of the resolved loans were for hospitality properties and 2 of the loans were for retail properties.
The history of the average losses incurred and the loss severity over the last 25 months is shown in the next chart. The chart shows the average loss incurred per resolved loan along with the average percentage of a resolved loan’s value that was lost during resolution.
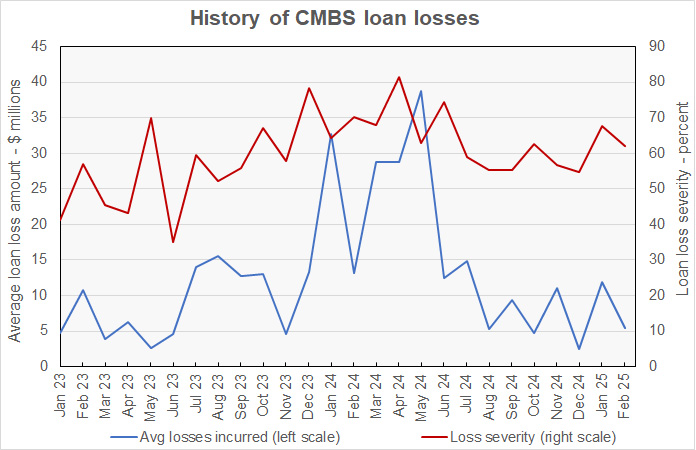
The chart shows that the severity of CMBS loan losses declined in February, falling 5.67 percentage points to 61.96 percent. This is slightly below the 12-month average of 63.53 percent. The average dollar loss per loan dropped in half, falling to $5.5 million. This is well below the average dollar loss per loan of $11.7 million seen over the last 12 months.
The number of loans resolving in February fell from 14 to only 7, the lowest level seen since last May. The total dollar value of the loans that resolved plunged to $79.7 million, only 1/3 of last month’s level and well below the 12 month average of $194.3 million.
Since monthly loan loss data can be volatile, Trepp also reports on the 12-month trailing average loss severity for loans with losses of greater than 2 percent. This figure was nearly unchanged, coming in at 65.15 percent this month, up from 65.13 percent last month. A year ago, it was 60.16 percent.
The February loan loss severity report can be found here.


