

The producer price index (PPI) report from the Bureau of Labor Statistics (BLS) stated that construction materials prices jumped 0.7 percent month-over-month in March on a seasonally adjusted basis. The index of components and materials for construction was up 1.8 percent from its year-earlier level.
Overall prices for processed goods for intermediate demand were unchanged for the month. The largest gain was for materials for durable manufacturing, which rose 3.1 percent for the month. The volatile price index of processed fuels and lubricants was down sharply, falling 3.2 percent. The overall processed goods for intermediate demand index was 0.9 percent higher than its year-earlier level.
For reference, the changes in these indexes compare with a 0.1 percent month-over-month fall and a 2.4 percent year-over-year rise in the seasonally adjusted all-items consumer price index (CPI-U) in March.
Yield Pro compiled the BLS reported changes for our standard list of construction materials prices. These are prices of materials which directly impact the cost of constructing an apartment building. The first two right hand columns of the table provide the percent change in the price of the commodity and the percent change in price from February (1 Mo PC Change) and from a year earlier (12 Mo PC Change). If no price data is available for a given commodity, the change is listed as N/A.
The pre-COVID column lists the change in the current construction materials prices relative to the average of prices from December 2019 through February 2020, before the pandemic impacted the economy. This provides a longer-term view of construction materials price trends.
| Commodity | 1 Mo PC Change | 12 Mo PC Change | Pre-covid Change |
| Softwood lumber | 4.7 | 12.6 | 29.0 |
| Hardwood lumber | 1.0 | 6.6 | 35.2 |
| General millworks | (0.1) | 0.9 | 31.9 |
| Soft plywood products | 0.6 | (6.1) | 61.7 |
| Hot rolled steel bars, plates and structural shapes | 2.3 | (11.4) | 37.4 |
| Copper wire and cable | 5.5 | 12.7 | 50.2 |
| Power wire and cable | 2.2 | 5.2 | 135.7 |
| Builder’s hardware | 0.6 | 2.9 | 28.0 |
| Plumbing fixtures and fittings | 0.0 | 2.6 | 22.4 |
| Furnaces and heaters | 0.3 | (0.4) | 37.8 |
| Sheet metal products | 1.5 | 1.3 | 50.3 |
| Electrical Lighting fixtures | 0.3 | 3.1 | 22.9 |
| Nails | (0.0) | (3.7) | 18.3 |
| Major appliances | (0.1) | (0.4) | 21.9 |
| Flat glass | 0.2 | 3.0 | 35.9 |
| Ready mix concrete | (0.4) | 0.5 | 37.9 |
| Asphalt roofing and siding | (0.2) | (0.6) | 40.9 |
| Gypsum products | 0.0 | 1.8 | 48.6 |
| Mineral wool insulation | 0.6 | 5.6 | 53.1 |
| CPI-U (unadjusted) | 0.2 | 2.4 | 24.0 |
The prices used by the BLS in compiling the indexes are collected on the Tuesday of the week containing the 13th day of the month. In March that would have been March 11. In the April report, the data collection date will be April 15.
The first chart, below, shows the price index history for wood products over the past 37 months.
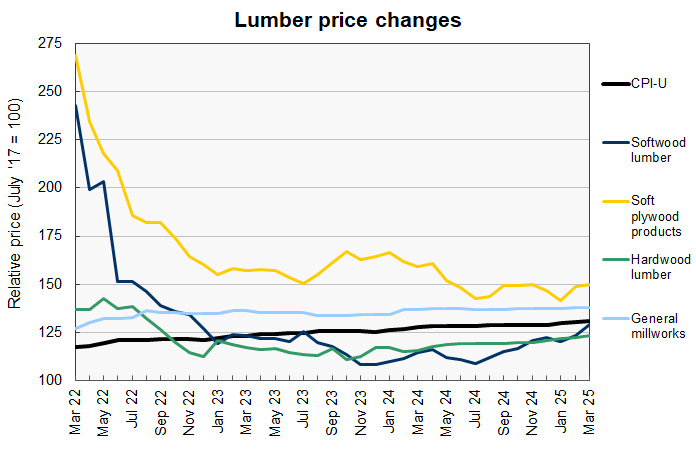
Softwood lumber prices surged higher in March on top of its jump last month. It rose 7.6 percent between the January and March reports. The quoted market price of lumber continued its sharp upward movement for the month of March, rising another 6.5 percent from its level on March 11 until it peaked on March 24. Since then, it has trended lower, closing on April 10 at 10.6 percent below its level on March 11.
Last month’s soft plywood price index was revised 0.3 percent lower in this month’s report, adding to its reported rise. Soft plywood prices have been relatively steady since June of last year. They are now 55 percent below their peak level.
The next chart, below, shows the recent history of several other construction materials prices. These are relatively simple commodities whose prices are strongly driven by those of the materials of which they are comprised.
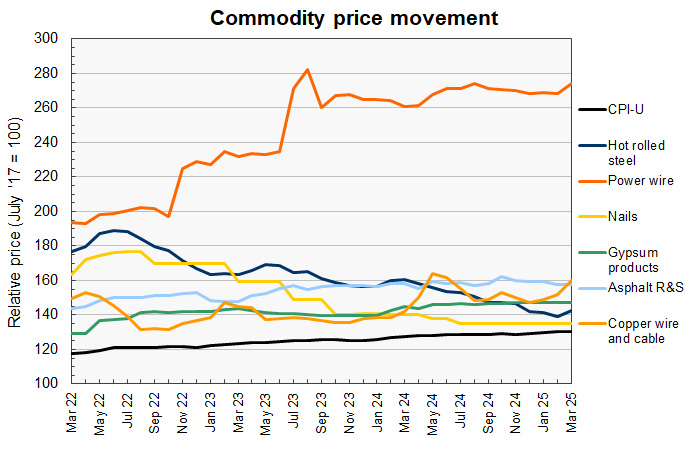
The price index for hot rolled steel bars was reported to rise 2.3 percent between the February and March reports, aided by a 0.6 percent downward adjustment in Feburary’s price index. The rise is surprisingly small since the market price of hot-rolled steel coil rose nearly 22 percent between February 11 and March 11 and has remained in the higher range since then.
The price index for copper wire rose by the greatest percentage of the construction materials prices we track this month. Its price index is up 8.5 percent since its recent low in December. Looking at the underlying material price, the market price of copper rose 9.5 percent from its level on March 11 until reaching its recent high on March 26. It has fallen since then, closing on April 10 at 8.5 percent below its level on March 11. However, its price movements over the last few days have been to the up side.
Price changes for several of the more finished goods from our sample are illustrated in the final chart, below.
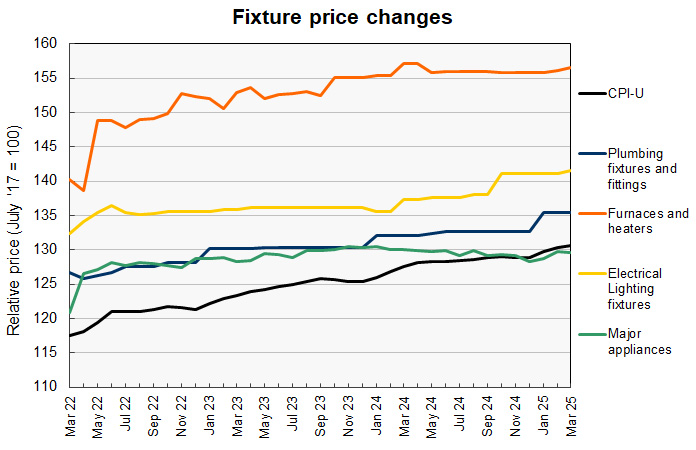
The changes to the construction materials prices for all of these commodities were relatively small this month and no revisions were made to the prices indexes of the previous months.
The full current BLS report can be found here.


