

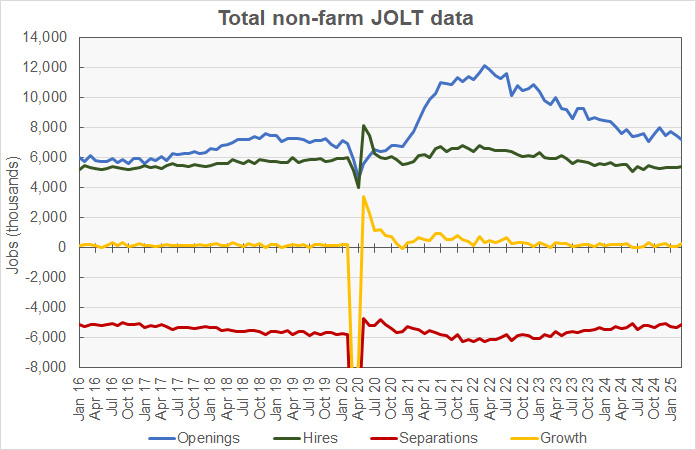
The Job Openings and Labor Turnover (JOLT) report from the Bureau of Labor Statistics (BLS) said that the number of total non-farm job openings in March was down to 7.19 million, continuing a 3-year trend of lower job openings. Job openings in both construction and real estate were also lower for the month.
Job openings were reported to be down 288,000 openings month-over-month. In addition, the openings figure for February was revised lower by 88,000 openings, so the March openings figure is 376,000 lower than the initial level reported for February last month. Job openings are down 901,000 openings from their year-ago level.
Despite the decline in job openings, hiring was reported to be up from last month’s revised (-26,000) figure for the economy as a whole, rising 41,000 to a level of 5.41 million hires. Total separations fell 179,000 from last month’s revised (+55,000) figure to a level of 5.14 million. Within total separations, quits were reported to rise 2.5 percent while layoffs fell 12.5 percent. Quits represented 64.9 percent of total separations for the month, the highest portion since September 2023 and well above the trailing 12-month average of 61.8 percent.
Overall openings down but hiring rises and quits fall
The March job openings figure represents 4.3 percent of total employment plus job openings. For comparison, the unemployment rate in March was reported to be 4.15 percent and 7.08 million people were unemployed. Another 5.92 million people said that they would like a job but were not counted as being in the labor force since they were not actively seeking employment.
For a discussion of the JOLT report and how it relates to the Employment Situation Report, please see the paragraph at the end of this article.
The excess of hiring over separations in the March JOLT report implies an employment increase of 274,000 jobs for the month. Last month’s employment increase was revised to 54,000 jobs, down by 81,000 jobs from the gain reported last month.
Of those leaving their jobs in March, 3.33 million quit voluntarily, while 1.56 million people were involuntarily separated from their jobs. The remainder of people leaving their jobs left for other reasons, such as retirements or transfers. The portion of people quitting their jobs rose 0.1 percentage point from last month’s figure to 2.1 percent of the labor force. The involuntary separations rate was down slightly from last month’s figure at 1.0 percent.
Total non-farm JOLT data since January 2016 is shown in the first chart, below.
Construction job openings, hiring and separations all lower
The next chart, below, shows the employment situation for the construction jobs market over the last 49 months. It shows that March saw a net loss of 11,000 construction jobs. In addition, last month’s preliminary gain of 10,000 jobs was revised to a loss of 1,000 construction jobs.
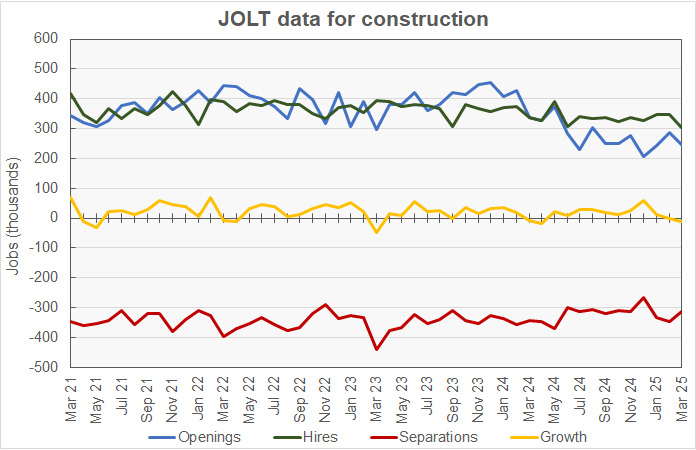
The preliminary job openings figure for March was reported to be down by 38,000 openings from last month’s revised (+22,000) figure at 248,000 openings. Openings were reported to be down 26.6 percent from last year’s level and were reported to represent 2.9 percent of construction employment plus job openings.
Hiring was reported to be down by 45,000 jobs in March from the prior month’s revised (-7,000) jobs figure to 302,000 new hires. The number of construction jobs that were filled in March was reported to be down 10.4 percent year-over-year.
Over the last 6 months, construction job openings have averaged 251,700 per month, but in the 12 months before that they averaged 355,800 per month, so there has been a significant recent drop off in construction job openings. Hiring has also seen a drop off, but not as dramatically. Over the past 6 months, new hires have averaged 336,000 per month while they averaged 352,100 over the prior 12 months.
Construction jobs total separations were reported to fall by 35,000 jobs from the prior month’s revised (+4,000) figure to 313,000 jobs.
Quits were reported to fall by 17,000 jobs from February’s revised (-1,000) figure to a level of 163,000 jobs. Quits represented 52.1 percent of separations for the month.
Layoffs were reported to fall by 5,000 from last month’s revised (+4,000) figure to 144,000 jobs.
“Other separations” which includes retirements and transfers, were reported to be down 12,000 at 6,000 jobs.
RERL job openings sharply lower but hiring holds up
The last chart shows the employment situation for the real estate and rental and leasing (RERL) jobs category. Employment in this jobs category was reported to be up 7,000 jobs for the month.
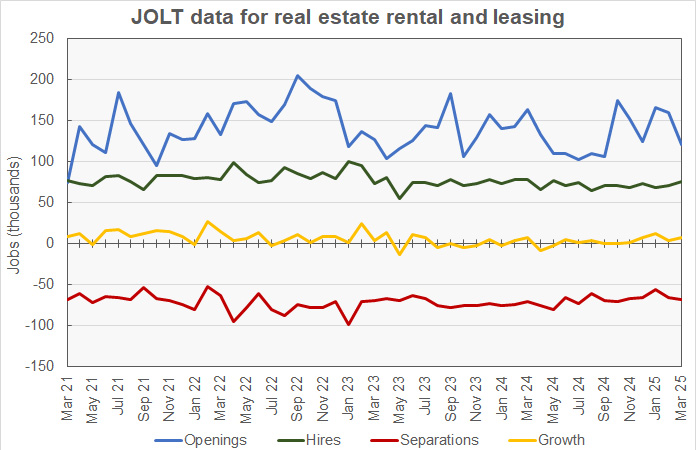
After two months of strong job openings figures, the number of job openings in the RERL category was reported to be down to 121,000 jobs at the end of March. This was 39,000 openings lower than the revised (-6,000) level reported for the month before. RERL job openings are down 25.8 percent from their year-ago level. Job openings in the RERL category represent 4.6 percent of total employment plus job openings, down 1.7 percentage points from the level in last month’s report.
Hiring in March was reported to be up by 5,000 jobs from last month’s revised (-1,000) figure at 75,000 jobs. The hiring figure was down 3.9 percent from the level of the year before.
Total separations in the RERL jobs category in March were up by 2,000 from February’s revised (-3,000) figure at 68,000 jobs.
Quits were unchanged from February’s revised (+1,000) figure at 39,000 jobs. Quits represented 57.4 percent of total separations. Layoffs were reported to fall by 1,000 from February’s revised (-5,000) figure to 22,000 jobs.
The numbers given in the JOLT report are seasonally adjusted and are subject to revision. It is common for adjustments to be made in subsequent reports, particularly to the data for the most recent month. The full current JOLT report can be found here.
Comparing the reports
The US labor market is very dynamic with many people changing jobs in any given month. The JOLT report documents this dynamism by providing details about job openings, hiring and separations. However, it does not break down the jobs market into as fine categories as does the Employment Situation Report, which provides data on total employment and unemployment. For example, while the Employment Situation Report separates residential construction from other construction employment, the JOLT report does not. The Employment Situation Report separates residential property managers from other types of real estate and rental and leasing professionals, but the JOLT report does not. However, the JOLT report provides a look at what is driving the employment gains (or losses) in broad employment categories.


