

Yardi Matrix reported that the national average asking apartment rent was up $5 in March compared to the revised level of the month before at $1,736 per month. The national average year-over-year asking apartment rent growth was +0.9 percent, down 0.1 percentage point from the rate reported last month. The month-over-month rent growth rate was 0.3 percent.
Rents in the “lifestyle” asset class, usually Class A properties, were up 0.1 percent year-over-year. Rents in “renter by necessity” (RBN) properties increased by 2.1 percent year-over-year. The lifestyle rent growth is down 0.1 percentage points from last month’s rate while the RBN rent growth is up 0.2 percentage points. The chart, below, shows the history of the year-over-year rent growth rates for these two asset classes along with the difference between these rates.
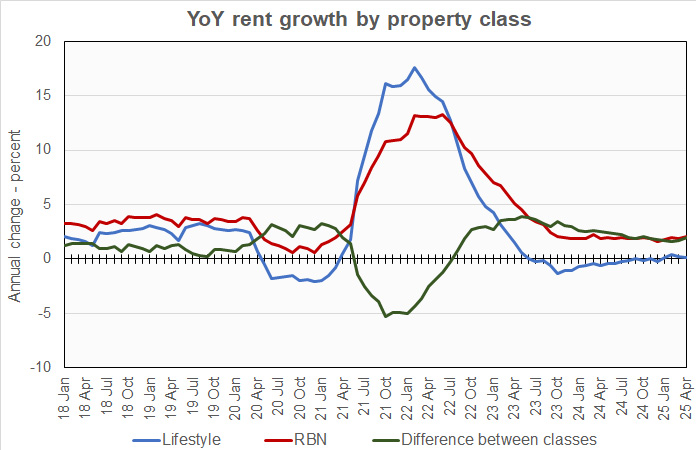
The year-over-year rent growth rate for lifestyle properties has now been positive for 4 consecutive months but the rate of growth has fallen for the past 2 months. Year-over-year rent growth for RBN properties has been hovering around 2 percent for the last year but the current month’s reading is the highest since March 2024.
Yardi Matrix reported that the U.S. average occupancy rate in February was down 0.1 percentage point from that reported last month at 94.4 percent. Yardi Matrix reported that this is the lowest occupancy rate they have seen since November 2013.
Uncertainty again
The discussion section of this month’s report focused on the impact of the uncertainty around President Trump’s tariff and economic policies on the multifamily business.
An indicator that uncertainty is impacting multifamily investment decisions is a sharp drop-off in multifamily CMBS activity. While activity in Q1 2025 was the highest since 2007, volume has dropped significantly in the first 3 weeks of Q2. However, Fannie Mae and Freddie Mac are still lending, and banks are also active, if selective.
Developers and builders are also facing uncertainty, with some reporting that price increases are already being seen.
Tabulating the data
Yardi Matrix reports on other key rental market metrics in addition to rent growth. These include the year-over-year job growth rate based on the 6-month moving average and the completions over the prior 12 months as a percentage of existing stock. The 10 metros with the largest annual apartment rent increases are listed in the table below, along with the other data.
| City | YoY rent | YoY rent last month |
YoY jobs (6 mo moving avg) |
Completions as % of stock |
| New York | 5.8 | 5.5 | 2.0 | 1.6 |
| Columbus | 3.7 | 3.5 | 0.9 | 3.8 |
| Philadelphia | 3.6 | 3.2 | 0.9 | 1.9 |
| Kansas City | 3.5 | 3.7 | 1.0 | 2.6 |
| Chicago | 3.3 | 3.7 | 0.6 | 1.7 |
| Indianapolis | 3.2 | 3.1 | 1.2 | 3.3 |
| Detroit | 3.0 | 2.7 | 0.6 | 0.5 |
| Twin Cities | 2.7 | 2.1 | 0.9 | 4.0 |
| Washington DC | 2.5 | 2.8 | 0.0 | 0.0 |
| New Jersey | 2.4 | 2.6 | 1.8 | 2.7 |
The major metros with the smallest year-over-year apartment rent growth as determined by Yardi Matrix are listed in the next table, below, along with the other data as in the table above.
| City | YoY rent | YoY rent last month |
YoY jobs (6 mo moving avg) |
Completions as % of stock |
| Austin | (5.6) | (5.4) | 2.1 | 8.8 |
| Denver | (3.9) | (3.6) | 0.5 | 6.2 |
| Phoenix | (3.1) | (3.0) | 0.6 | 5.2 |
| Dallas | (2.1) | (1.7) | 1.3 | 3.9 |
| Orlando | (2.1) | (1.3) | 1.9 | 6.0 |
| Atlanta | (1.6) | (1.6) | 1.2 | 3.9 |
| Las Vegas | (0.9) | 0.1 | 1.1 | 3.5 |
| Nashville | (0.8) | (1.0) | 1.3 | 6.2 |
| Raleigh | (0.6) | (1.5) | 1.9 | 6.2 |
| Charlotte | (0.1) | 0.3 | 1.2 | 5.5 |
The top metros for month-over month rent growth in March were Raleigh, Columbus, Boston and Indianapolis. Of these, only Boston was in the top 4 in last month’s report. The trailing metros this month were Orlando, Las Vegas, Dallas and Phoenix. Of these, only Phoenix was in the bottom 4 in last month’s report.
Single-family rentals rents higher
Yardi Matrix also reported that single-family rental build-to-rent (SFR) rents rose $5 in March from the revised level of the month before to $2,178 per month. The year-over-year SFR rents for lifestyle properties were down 0.4 percent while rents for RBN properties were up by 1.9 percent.
Yardi Matrix reported on the top 34 markets for built-to-rent single-family rentals, 15 of which saw rents grow year-over-year in March. The leading markets for year-over-year rent growth were Detroit, Inland Empire, Harrisburg and Kansas City.
The markets with the lowest year-over-year rent growth were Austin, Pensacola, Cleveland and Phoenix.
The national occupancy rate for single-family rentals remained at 94.8 percent. This is up 0.1 percentage point from last month’s reported value but down 0.6 percent year-over-year.
This month, 11 of the metros saw year-over-year occupancy increases. The metros with the largest year-over-year occupancy increases were Jacksonville, Salt Lake City, Austin and Atlanta. The metros with the greatest occupancy declines were Greenville, Detroit, Las Vegas and Denver.
The complete Yardi Matrix report provides information on some of the smaller multifamily housing markets and more information on the differences in results between lifestyle and RBN properties. It can be found here.


