

The latest commercial property price report from MSCI Real Capital Analytics said that multifamily property prices were down 0.4 percent month-over-month in April compared to the revised level of the month before. Prices were down 1.09 percent year-over-year.
Defining CPPI
MSCI tracks an index called the Commercial Property Price Index (CPPI). The index is computed based on the resale prices of properties whose earlier sales prices and sales dates are known. The index represents the relative change in the price of property over time rather than its absolute price. Note that, as new property transactions are added to the MSCI dataset each month, they recalculate the CPPI for the months in which the transactions occurred, potentially all the way back to the beginning of the data series.
Multifamily property price drop accelerates
The first chart, below, shows how the CPPI’s for all commercial property as a single asset class and for apartments have changed since January 2016. Both CPPI’s have been normalized to values of 100 in January 2012. The chart also contains trend lines showing the straight-line average rates of price appreciation for the two asset classes based on their performances from January 2012 to December 2019, a period in which property price appreciation was remarkably steady.
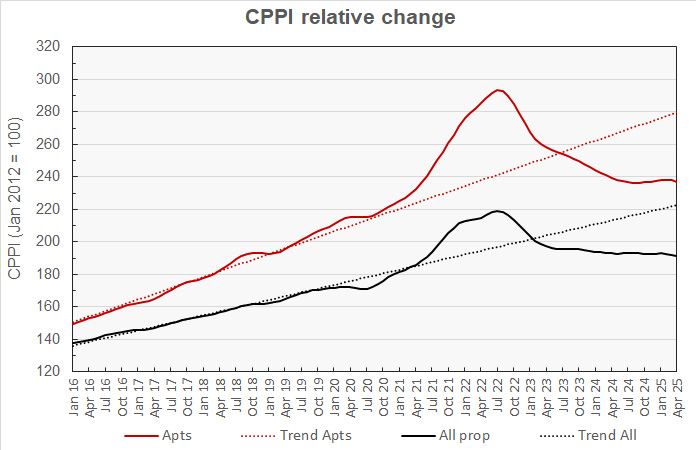
The chart shows that multifamily property prices hit a low point in August of last year. They then began to rise, reaching a high point in February. However, multifamily property prices have been falling for the last 2 months based on the latest transaction data.
Multifamily property prices are now down 19.2 percent from their peak but are 12.3 percent above their level in January 2020. They are 15.3 percent below their pre-pandemic trend line.
Prices for all commercial property as a single asset class were down 0.4 percent month-over-month in April and were down 0.8 percent year-over-year. They are now 12.5 percent below their peak but are 11.4 percent above their level in January 2020. They are 14.0 percent below their pre-pandemic trend.
The next chart plots the month-over-month changes in the values of the CPPI over the last 13 months for all commercial property as a single asset class and for apartments. It also includes the same metrics based on the data included in last month’s report and the report from the month before that.
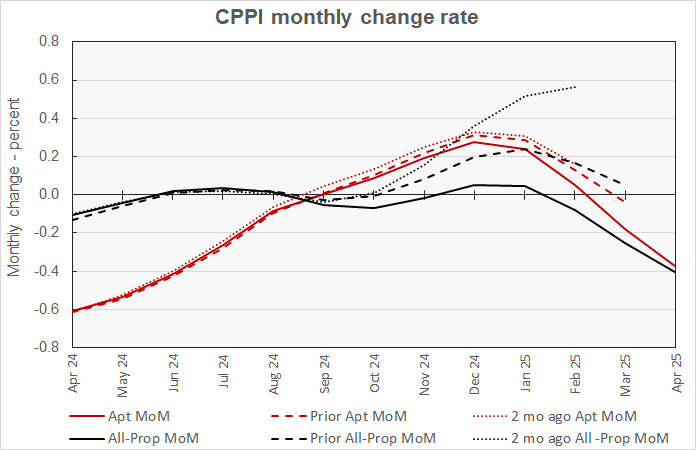
The chart shows that transactions added to the dataset over the last two months have tended to make the multifamily property price trajectory appear worse. For example, the month-over-month price change for February was seen as being +0.16 percent two months ago, but was reduced to a gain of 0.13 percent with last month’s revisions and to a gain of only 0.05 percent with this month’s revisions. The month-over-month multifamily property price change for March was reported as -0.04 percent last month but was changed to -0.18 percent in this month’s report.
The chart also shows that a similar pattern appears in the changes to the pricing data for all commercial property considered as a single asset class, but to a greater degree. Its new data for February revised that month’s price movement from an increase of 0.56 percent originally reported to a loss of 0.08 percent in the latest report.
Property prices mixed in April
In April, MSCI found that prices rose for office and retail properties but fell month-over-month for industrial property. Industrial property prices fell by 0.4 percent for the month. Prices for retail property rose by a 0.2 percent. Prices for suburban offices rose 0.7 percent for the month while prices for offices within central business districts (CBDs) rose 0.1 percent.
Retail property prices rose by the greatest amount on a year-over-year basis with a 4.2 percent increase. Industrial property prices were also higher year-over-year, rising 0.4 percent. Prices also rose for suburban offices, with a gain of 1.0 percent. However, prices were lower for offices in CBD’s with a 3.8 percent drop.
Major metro commercial property prices continue to fall
The MSCI report provides data comparing the price changes of commercial property in 6 major metro* areas against those in the rest of the country, although it does not separate apartments from other commercial property types in this comparison. The next chart, below, plots the history of the relative price indexes since January 2016 for both market segments, along with trend lines based on straight-line fits to the changes in these indexes between January 2012 and December 2019. For purposes of this chart, both price indexes were set to values of 100 for January 2012.
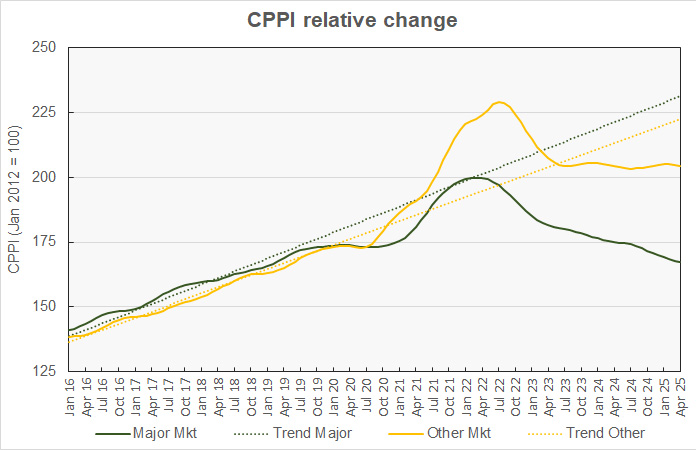
The chart shows that the CPPI for major metro commercial property has been on a downward path since peaking in March 2022. On the other hand, property prices in non-major metros have shown some signs of life, achieving gains in the autumns of the last two years.
In the latest report, major metro property prices are down 0.4 percent month-over-month and 4.5 percent year-over-year. They are down 16.3 percent from their peak and are now 3.7 percent below their level in January 2020. They are 27.7 percent below their long-term trend.
The non-major markets CPPI is down 0.3 percent month-over-month and down 0.03 percent year-over-year. It has now fallen 10.9 percent from its peak but is 17.9 percent above its level in January 2020. The non-major metro CPPI is 8.2 percent below its pre-pandemic trend.
The final chart plots the history of the month-over-month changes in the price indexes for the two property market segments over the last 13 months along with the monthly price change data from the last two reports.
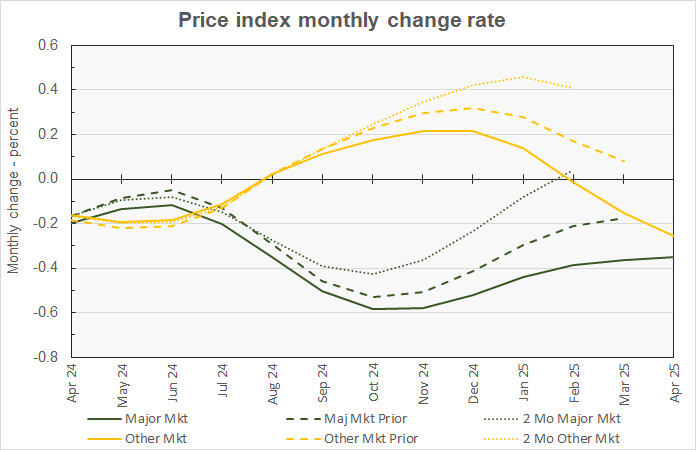
The chart shows that the last 2 months of updates to the pricing data for the non-major metros reveal a progressively more negative pricing picture. This is true for both the major metro and the non-major metro property prices. For example, the major metro month-over-month price growth for February was initially reported to be +0.04 percent, but it was revised down to -0.21 percent last month and to -0.39 percent this month.
The full report provides more detail on other commercial property types. Access to the MSCI Real Capital Analytics report can be obtained here.
*The major metros are Boston, Chicago, Los Angeles, New York, San Francisco and Washington DC.


