Higher education generally supports a more productive workforce and higher wages. However, as U.S. student debt has disproportionately ballooned and college curriculum has veered toward the arcane in order to reap the windfall, the risk-benefits model has shifted. One notable outcome is a new generation of renters, albeit poorer and more insolvent.
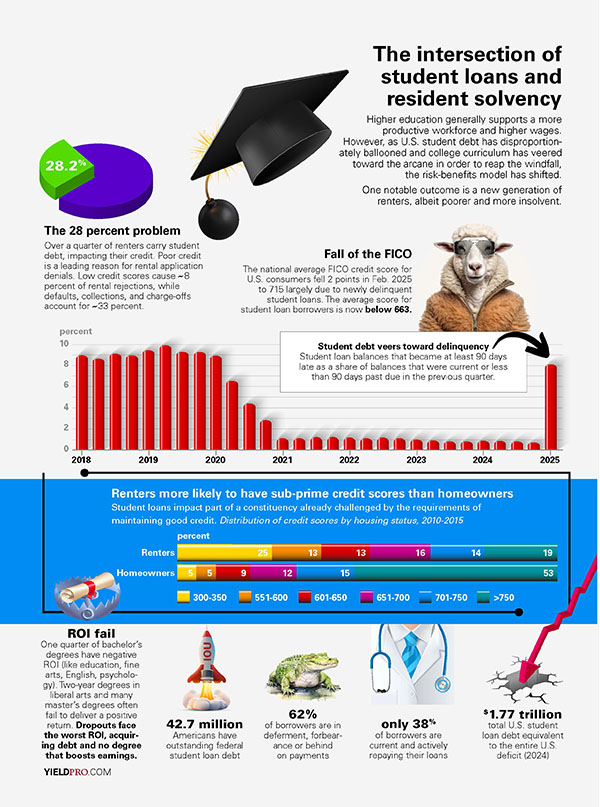
The 28 percent problem
Over a quarter of renters carry student debt, impacting their credit. Poor credit is a leading reason for rental application denials. Low credit scores cause ˜8 percent of rental rejections, while defaults, collections, and charge-offs account for ˜33 percent.
Fall of the FICO
The national average FICO credit score for U.S. consumers fell 2 points in Feb. 2025 to 715 largely due to newly delinquent student loans. The average score for student loan borrowers is now below 663.
Student debt veers toward delinquency
Student loan balances that became at least 90 days late as a share of balances that were current or less than 90 days past due in the previous quarter. (07-02-2025 UPDATE: The current 5 percent figure is unchanged from the previous quarter and slightly below the recent peak of 5.3 percent in 2024 Q4.)
Renters more likely to have sub-prime credit scores than homeowners
Student loans impact part of a constituency already challenged by the requirements of maintaining good credit. Distribution of credit scores by housing status, 2010-2015
Credit score
Renters:
300-350 25 percent
551-600 13 percent
601-650 13 percent
651-700 16 percent
701-750 14 percent
>750 19 percent
Homeowners:
300-350 5 percent
551-600 5 percent
601-650 9 percent
651-700 12 percent
701-750 15 percent
>750 53 percent
ROI fail
One quarter of bachelor’s degrees have negative ROI (like education, fine arts, English, psychology). Two-year degrees in liberal arts and many master’s degrees often fail to deliver a positive return. Dropouts face the worst ROI, acquiring debt and no degree that boosts earnings.
42.7 million Americans have outstanding federal student loan debt
62 percent of borrowers are in deferment, forbearance or behind on payments
only 38 percent of borrowers are current and actively repaying their loans
$1.77 trillion total U.S. student loan debt equivalent to the entire U.S. deficit (2024)
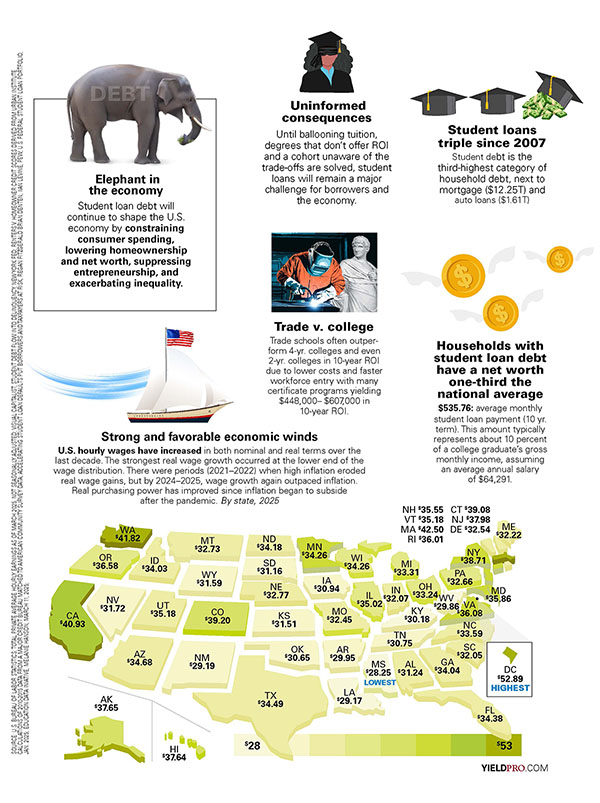
Elephant in the economy
Student loan debt will continue to shape the U.S. economy by constraining consumer spending, lowering homeownership and net worth, suppressing entrepreneurship, and exacerbating inequality.
Uninformed consequences
Until ballooning tuition, degrees that don’t offer ROI and a cohort unaware of the trade-offs are solved, student loans will remain a major challenge for borrowers and the economy.
Student loans triple since 2007
Student debt is the third-highest category of household debt, next to mortgage ($12.25T) and auto loans ($1.61T)
Trade v. college
Trade schools often outperform 4-yr. colleges and even 2-yr. colleges in 10-year ROI due to lower costs and faster workforce entry with many certificate programs yielding $448,000–$607,000 in 10-year ROI.
Households with student loan debt have a net worth one-third the national average
$535.76: average monthly student loan payment (10 yr. term). This amount typically represents about 10 percent of a college graduate’s gross monthly income, assuming an average annual salary of $64,291.
Strong and favorable economic winds
U.S. hourly wages have increased in both nominal and real terms over the last decade. The strongest real wage growth occurred at the lower end of the wage distribution. There were periods (2021–2022) when high inflation eroded real wage gains, but by 2024–2025, wage growth again outpaced inflation. Real purchasing power has improved since inflation began to subside after the pandemic. By state, 2025
Alabama $31.24
Alaska $37.65
Arizona $34.68
Arkansas $29.95
California $40.93
Colorado $39.20
Connecticut $39.08
Delaware $32.54
Florida $34.38
Georgia 34.04
Hawaii $37.64
Idaho $34.03
Illinois $35.02
Indiana $32.07
Iowa $30.94
Kansas $31.51
Kentucky $30.18
Louisiana $29.17
Maine $32.22
Maryland $35.86
Massachusetts $42.50
Michigan $33.31
Minnesota $34.26
Mississippi $28.25 (lowest)
Missouri $32.45
Montana $32.73
Nebraska $32.77
Nevada $31.72
New Hampshire $35.55
New Jersey 37.98
New Mexico $29.19
New York $38.71
North Carolina $33.59
North Dakota $33.59
Ohio $33.24
Oklahoma $30.65
Oregon $36.58
Pennsylvania $32.66
Rhode Island 36.01
South Carolina $32.05
South Dakota $31.16
Tennessee $30.75
Texas $34.49
Utah $35.18
Vermont $35.18
Virginia 36.08
Washington $41.82
West Virginia $29.86
Wisconsin 34.26
Wyoming 31.59
Source: U.S. Bureau of Labor Statistics; total private average hourly earnings as of March 2025, not seasonally adjusted; Visual Capitalist; student debt flow into delinquency, New York Fed; renters v. homeowner credit scores derived from Urban Institute Calculations of 2010-2015 data from a major credit bureau matched to American Community survey data; accelerating student loan defaults put borrowers and taxpayers at risk, Regan Fitzgerald Brian Denten, Iian Levine, Pew; U.S. Federal Student loan portfolio, Jan. 2025; Education Data Initiative, Melanie Hanson, March 11, 2025