Last week, the Census Bureau released the 2016 County Business Patterns (CBP) report. Comparing this report to those from prior years paints a picture of growing multifamily employment and increasing pay.
A snapshot of American industry
The CBP report provides information on the number of business establishments and employees in the country as well as the levels of business payrolls. It is a snapshot of American business taken annually during the week which includes March 12. The data can be broken down by geography, although this blog only looks at the data for the country as a whole, and by business type as defined in the North American Industry Classification System (NAICS). Unlike the report the BLS released the week earlier on job turnover, the CBP report drills down to specific industry sub-groups so the multifamily industry can be examined specifically.
The NAICS has two categories which cover the multifamily industry: Lessors of residential buildings and dwellings (residential lessors), and Residential property managers (property managers). The former category includes owners and owner/operators while the latter category includes companies which manage residential property for others.
How to read the charts
The first two charts compare multifamily employment and the number of establishments in multifamily to the numbers in the entire US economy. Because of the huge difference in the numbers for the economy as a whole compared for those for multifamily, it would be difficult to place both sets of values on a single chart. Therefore the values shown in the first two charts for each variable are normalized to their values in 2008. That is, the values shown are the value of the variable for the indicated year divided by the value of that variable for 2008. A value of 1.2 in the chart means that the value of that variable is 20 percent higher than it was in 2008. A value of 0.9 means that the value of that variable is 10 percent less than it was in 2008.
Reviewing employment history
The first chart presents total US employment over time along with multifamily employment. It shows that the employment peak the US economy reached in 2008 was not matched until 2014 and that employment in 2016 was only 5 percent higher than that peak. It shows that employment for multifamily property managers was not as highly impacted by the recession as employment for the economy as a whole and that it has grown much more strongly in the last 8 years.
The story for the residential lessor industry is more complicated. Employment in that industry peaked 2 years earlier than for the economy as a whole. The percentage drop in multifamily employment in the residential lessor industry from that earlier peak to the low point in 2010 was as great as the drop in employment for the economy as a whole. However, the recovery of the residential lessor industry since 2008 has been more robust.

Business survival and growth
The second chart presents the relative number of business establishments in the US economy as a whole along with those of the two multifamily industry sectors. The chart shows that the number of business establishments which say that their primary business is property management has been increasing at a must faster rate than has the number of all US businesses. The growth in property management business establishments barely paused during the recession and continued strong through 2016.
The chart shows that the recent history of the growth in the number of residential lessor business establishments has been less bright. There was a larger percentage drop in the number of residential lessors between 2005 and 2010 than there was in the number of all US businesses between 2007 and 2010. However, since 2010, the number of residential lessors has been increasing at a much faster rate than has the number of all US businesses.
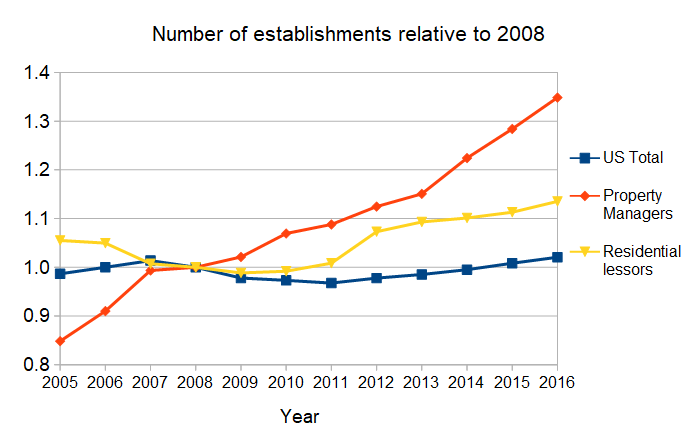
By the way, while the chart may lead viewers to think that there are currently more property managers than residential lessors in the US, this is not the case. The chart shows relative growth since 2008 and, in 2008, there were many more residential lessors than there were property managers. Even in 2016, residential lessors outnumbered property managers by 68,086 to 49,449 according to the CBP.
The business of America is (small) business
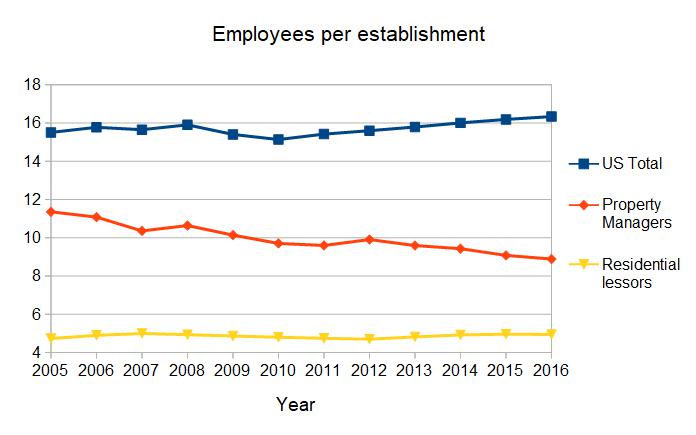
The third chart presents the average number of employees per business establishment. It shows that the average multifamily business is small. The decrease in the average number of employees in the residential property management industry indicates that growth in industry employment has been driven by new, small, entrants to the industry rather than by growth in the larger industry players.
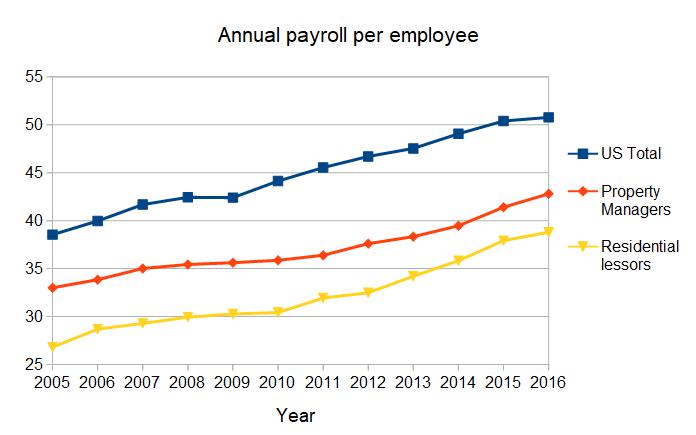
The final chart presents the average annual payroll dollars per employee along with the average for all US business establishments. It show that workers in the multifamily space are paid less, on average, than US workers in general. Workers for property managers lost a little ground compared to the national average after 2009 but have recently been making up lost ground. Workers for residential lessors are paid even less, on average, but have been catching up in the last 3 years. In 2016, average annual payroll per employee was $42.8 thousand in property manager establishments and was $38.8 thousand in residential lessor establishments.