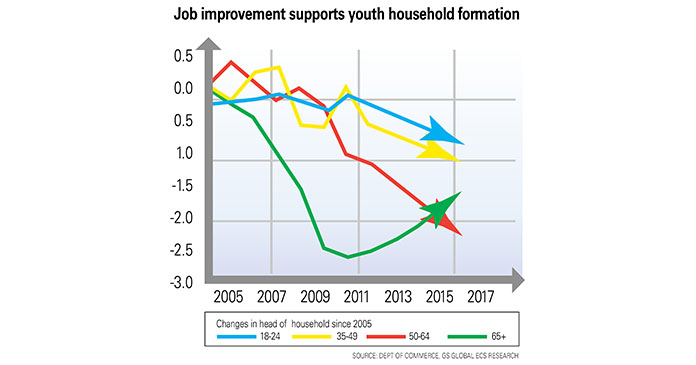
To get some sense of how much higher demand for housing would have been if household formation had remained at its precrisis pace, here’s an excerpt from the Goldman note: “Holding headship rates within each age group constant at their 2007 level, growth in the size of the population and changes in its age structure would have warranted annual household formation of 1.3 to 1.4 million per year over the last few years. The reason that actual household formation was only about half that amount per year was a decline in headship rates within age groups-and in particular, a sharp drop in the headship rate for persons aged 18 to 34.” (Headship rate is the percentage of people in a given age group who head up households.)
The Goldman economists estimate that 60 percent of the slowdown in household formation was caused by the decline in headship rates for the 18-34 demographic. Another 20 percent is attibutable to declines in headship rates for the rest of the population, and the remaining 20 percent is down to a combination of the population getting older and slower net immigration.
The focus on young adults also matters for other reasons: This is the age demographic with the highest percentage of renters and it’s the category whose headship rates are most sensitive to changes in employment.
Given recent improvements in the labor market, the economists estimate that the decline in headship rates for the 18-34 group has ended.
Think about all those households that would have been started in the last few years but weren’t because of the employment catastrophe. Presumably, with the exception of people who went back to school, a lot of them would still like to start households, and move out of their parents’ basements. If you wish to think in such terms, they represent the equivalent of pent-up demand for goods.
This is something to keep in mind when you hear about the inventory overhang. It’s true that there remains a big number of distressed properties that haven’t hit the market, and clearing that excess supply is influencing home prices. But it’s also true that both existing and shadow inventory are coming down pretty fast. There’s a lot of demand for new housing that’s waiting not for prices to fall further or for inventory to clear, but simply for more jobs to be created.
A lot of inventory might never get sold, and to that extent, this part of the shadow inventory is essentially dead property. Then don’t supply-demand dynamics mean this should bolster the rebound in housing rather than hinder it?
Maybe nobody wants to buy one of the empty houses in Las Vegas or Tampa or wherever, at any price. Many people who want to start new households will no longer want to buy houses at all. If they want to rent, multifamily construction was weak even before the recession, so new demand will lead to more investment and construction; indeed higher rents have been pushing multifamily starts-up in the past year as single-family starts only started ticking up recently. There’s no reason this can’t continue.
When might it happen? We don’t know, but the final assessment by the Goldman economists strikes us as too cautious: “We forecast household formation of 0.8 million in 2012 and 1.1 million in 2013. Over the next five years we expect that household formation will average about 1.1 million per year. Rising headship rates for the youngest age cohort account for about 200,000 new households per year in the outer year forecasts. The remainder of the growth in new households results from underlying population growth, partly offset by falling headship rates for older age cohorts. If we were to use the Census Bureau’s baseline immigration assumptions, this would mean an additional 100,000 households per year on top of our estimates.”
Goldman continues, “This gradual rebound in household formation should help absorb excess inventory in the housing market, which we currently estimate to be about 2.5 million units. Assuming net additions to the housing stock continue at the current pace of about 300,000 per year, our forecast for household formation would imply that the current excess could be cleared in about 3.5 years.”
And finally Goldman states, “Given the long period of weak household formation, why not a stronger recovery? First, while there does seem to be evidence of pent-up demand in the 18 to 34 age group, our models suggest that headship rates are driven mainly by employment-to-population ratios. Therefore, with job growth still moderate, headship rates are unlikely to snap back quickly. Second, secular trends in some cases may continue to put downward pressure on headship rates. Falling marriage rates among the young, for example, may bechanging social norms about when adulthood begins, and delaying the formation of new households.”
Goldman has used very conservative estimates to arrive at this conclusion. They assume jobs growth of 150,000 per month for the next two years, and also that net immigration will slow. But the jobs growth assumption is smaller than the pace we’ve had over the last half-year. There’s also the possibility of a virtuous cycle that becomes self-sustaining- more jobs leads to more housing demand which leads to the demand of other stuff which leads to more jobs, etc.
Author: Cardiff Garcia, ft.com


