

Apartment List has issued their rent growth report for April, 2019. It shows a slower rate of rent growth in the 12 months to March, 2019 than in the equivalent period in the prior two years. It also shows a slower rate of rent growth overall than do reports from other sources such as Yardi Matrix.
Taking another look
As discussed when we first reported on Apartment List’s analysis of the rental market, they use a different methodology than do other data sources. Apartment List bases their rent calculations on all rentals as reported by the US Census Bureau and makes adjustments for rent growth by looking only at rent changes for the same units, much as Case-Shiller does in reporting home price changes.
Key findings from the report are summarized in a graphic, reproduced below. It shows the pattern of rent increases for the last 12 months of the current year compared to the patterns of the previous two years. The chart shows the same trend as do reports from other sources. Rents increase in the spring as the prime rental season gets under way but then remain relatively constant, or even decline, through the winter months.
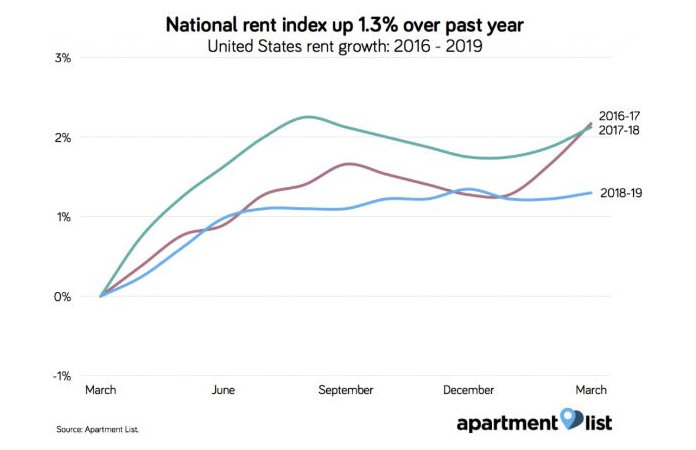
The difference in Apartment List’s report is that the size of the movements in market rents are smaller. For example, Yardi Matrix reported that rents increased 3.6 percent in the last 12 months while Apartment List reported an increase of only 1.3 percent. The Apartment List report also shows that the start of the springtime rise in rents is much more subdued than in recent years, possibly indicating a softer rental season ahead. The latest report from Yardi Matrix also showed relatively flat rents, but it only goes through February and so it reflects data from a little earlier in the cycle.
Drilling down to the cities
Both Apartment List and Yardi Matrix agree that the city with the fastest rent growth is Phoenix, Az. However, Yardi Matrix reports its annual rent growth at 8.0 percent while Apartment List pegs it at 3.7 percent. The differences in the reported annual rent changes between the two reports for 5 top cities is shown in the following table.
| City | Yardi Matrix (Feb ’18 to Feb ’19) |
Apartment List (Mar ’18 to Mar ’19) |
| Phoenix | 8.0 | 3.7 |
| Las Vegas | 7.9 | 2.9 |
| Sacramento | 5.1 | 1.2 |
| Atlanta | 5.1 | 2.5 |
| Austin | 4.5 | 3.1 |
Part of the difference in the reported changes may be explained by the fact that Yardi Matrix reports on the city and its metro area as a whole while Apartment List focuses more on the city itself. Still, the difference in the reported rent changes for the two reports is striking.
The Apartment List report has other interesting charts showing rent changes over one-year and five-year time spans for selected cities. It also contains an interactive table where you can look up the rent data on any of 881 entities (states or cities) in the US.
The full report may be viewed here.


