This week, RealPage presented its quarterly national multifamily housing market update webcast. It described a market with strong demand for multifamily housing and moderate rent growth.
Demand surges
Reports issued earlier this year from other sources had described a multifamily housing market where the “leasing season” of the spring and summer months had gotten off to a slow start. RealPage reported that this changed in the second quarter as leasing activity really took off. The 150 largest metro areas saw a net absorption of 177,000 units, 25 percent higher than the average level for this quarter in the years since the last recession. Three factors were cited as demand-drivers.
- Strong job growth drove strong household formation
- Apartments took a larger share of housing demand as the home ownership rate fell
- The earlier lull in leasing activity shifted demand into the second quarter
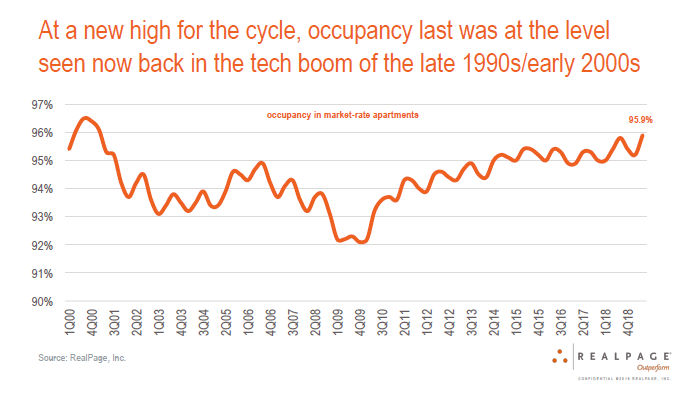
Supply of new units in the second quarter did not keep up absorption, leading to a rise in occupancy rates. Occupancy reached 95.9 percent in the quarter, up from 95.2 percent in the 1Q 2019 and up from 95.4 percent in the second quarter of last year. In fact, occupancy reached the highest level since the year 2000, as is show in the following chart taken from the presentation.
Another trend that emerged from the 2Q data was that more renters are renewing their leases. Resident retention rose to 53.4 percent in the 50 largest metro areas, although the retention rate varied by product class and geography. Retention rates continued their rebound from a dip in 2017 and reached their highest level since the last recession. By product class, retention was only 48.7 percent for renters of class A units, 51.7 percent for renters of class B units and 56.5 percent for renters of class C units.
Rents continue their rise
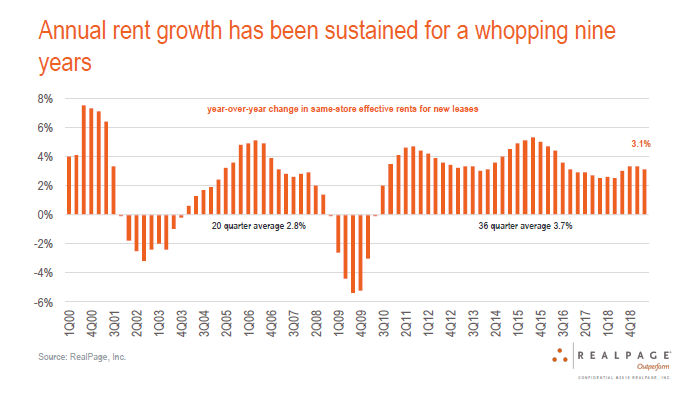
Rent growth for new leases in 2Q 2019 came in at 3.1 percent, compared to year-earlier levels. This makes 36 straight quarters where rents have increased, although the rate of rent growth was less than the average of 3.7 percent seen over that time span. By apartment class, rent growth was 2.9 percent for class A units, 3.4 percent for class B units and 3.1 percent for class C units. The history of rent increases for new leases since 2000 is shown in the following chart from the report.
Rent growth for lease renewals came in at 4.6 percent in 2Q 2019 for the 50 largest metros, in line with recent performance.
Deliveries of new units continues apace
RealPage data shows that there are 526,000 market rate apartments currently under construction. They are expected to be completed over the next 18 months or so. In the 12 months ending in 2Q 2019, 285,000 new units were delivered. Surveys of developers indicate that deliveries of new units may rise in the next year or two. However, developers have been experiencing delays in their deliveries recently and it is thought likely that these will continue.
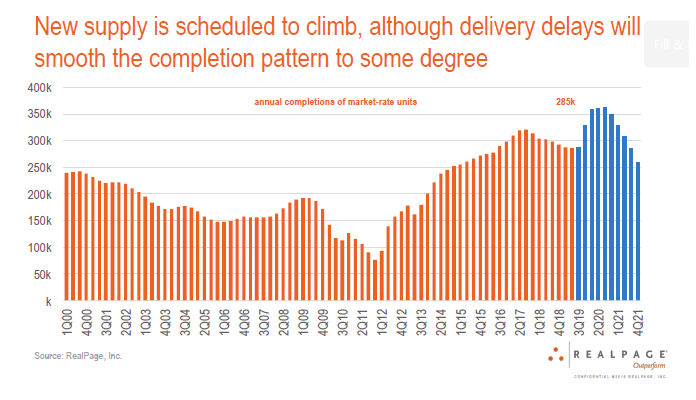
Looking ahead, RealPage noted that the number of permits issued for new multifamily units has declined recently and that this may be reflected in a lower level of new supply coming to market 18 to 24 months from now. They expect the rate of job growth to continue to decline in the near term, reaching a low point in 2Q 2021.
At the end of 2019, RealPage forecasts the average occupancy in the 150 largest metro areas to be 95.4 percent. They expect year-over-year rent growth at that time to be 3.1 percent. These are the numbers of a healthy multifamily housing market.
The full webcast runs a little more than 30 minutes and discusses other topics, such as which markets are doing particularly well, the level of rent concessions now being offered and the current strength of capital markets for multifamily housing. It can be found here.


