

A report from Moody’s Analytics attempts to predict the impact of the fallout from the COVID-19 pandemic on the credit quality of commercial real estate (CRE) loan portfolios backed by multifamily and other property types.
Is multifamily recession-proof?
Certain commercial property types have been hard hit by the economic showdown caused by the response to COVID-19. This is particularly true for hotels and retail. Because housing is an essential business, there is the impression that it will be less impacted by the slowdown. However, Moody’s Analytics included a chart in their report, reproduced below, that indicates that this is not true, at least if impact is measured by the ability of multifamily mortgage holders to remain current on their loans.
The chart tracks the portion of CRE loans that are in nonaccrual state (no payment received for 90 days) over time. The chart indicates that the historical performance of multifamily loans during bad times is not materially different than the performance of other commercial loan types. However, multifamily loan nonaccrual rates are noticeably lower in good times. For example, while loans on multifamily properties represented 31 percent of outstanding commercial loan value as of Q4 2019, they represented only 6 percent of loan value in nonaccrual status at that time.
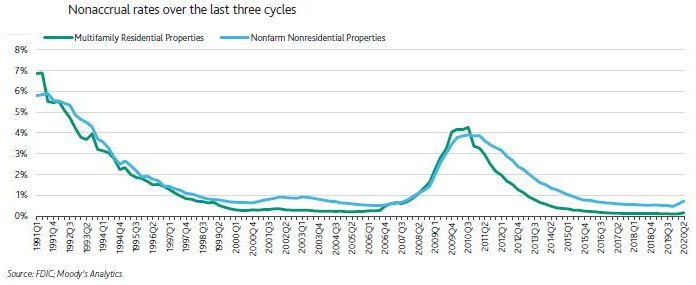
While it is barely visible on the chart, Moody’s Analytics reports that, from Q4 2019 to Q2 2020, the dollar value of multifamily loans in nonaccrual status rose by 67 percent while the dollar value of nonfarm nonresidential property loans in nonaccrual status rose by 59 percent. However, the report points out that nonaccrual rates are likely being suppressed right now due to policies of mortgage forbearance and modification, so these levels of increase may not accurately represent current levels of distress in the commercial property mortgage market. In addition, peak nonaccrual rates are generally not reached until 2 to 3 years after a downturn has begun. The rise in nonaccrual rates is probably only just beginning.
Potential loan losses
The report examines potential loan losses under three scenarios. The first is Moody’s Analytics baseline estimation of how the pandemic will play out. It assumes a strong level of economic growth in Q3 2020 followed by low, but positive, growth until late 2021. Growth picks up after that time, reaching 10 percent on an annualized basis for several quarters. This is the scenario which Moddy’s Analytics thinks is most likely.
The second is a scenario created by the US Federal Reserve postulating that the economy will experience a U-shaped recovery. It predicts continued economic contraction in Q3 2020 followed by low, but positive, growth for the next several years.
The final is another scenario postulated by the Federal Reserve, this one where the economy experiences a W-shaped recovery due to a resurgence of COVID-19 in the fall. It predicts strong growth in Q3 2020, with growth falling into negative territory by Q2 2021. The economy slowly recovers from that point, returning to positive growth in Q1 2022.
Note that the two scenarios postulated by the Federal reserve assume very different levels of economic activity in Q3 2020, but the fundamental difference between them is said to be that one predicts a resurgence of COVID-19 late this year and one does not. Since that resurgence would occur after Q3, it cannot possibly account for the difference in economic growth shown for that period. Therefore, these scenarios cannot have been developed based on their likelihood of occurring but rather just represent two of an infinite variety of outcomes possible as the progression of the pandemic, and that of the government’s response to it, play out.
The expected (most likely) total levels of losses on loans for multifamily properties from the start of the pandemic for each of these scenarios are given in the following table.
| Scenario |
1 year (Q2 ’21) |
2 year
(Q2 ’22) |
3 year (Q2 ’23) |
| Moody’s Analytics baseline | 1.8% | 2.6% | 3.0% |
| Fed U-shaped | 5.0% | 6.4% | 6.7% |
| Fed W-shaped | 3.7% | 7.0% | 8.1% |
While an 8.1 percent loss in multifamily mortgage loan portfolios may seem like a lot, the loss for hotel mortgage portfolios under the same scenario is 26.1 percent. On the other hand, the expected loss for industrial property loan portfolios at 3 years under the Fed W-shaped recovery scenario is only 4.4 percent.
This is a brief summary of a 16 page article. The full article contains discussions of other factors in the economy under the three scenarios. These include unemployment levels, interest rates, credit spreads and credit ratings shifts. It also discusses nonaccrual rates for loans on other commercial property types. The full report can be found here.


