

The Census Bureau released its monthly new residential construction report for August 2020. It shows a slowdown in all phases of multifamily housing construction.
Permits fall
The number of permits issued for buildings with 5 or more units fell sharply in July to 381,000 units on a seasonally adjusted, annualized basis. This was down 17 percent from the July figure, which was itself adjusted down by 60,000 units. This continues a pattern which has been in place since January where the number of permits reported falls sharply in even numbered months only to rise sharply in odd numbered months. The pattern since January (in thousands) has been: -117, +27, -59, +61, -50, +83 and -81. August permits were down 29 percent from the very high number of permits issued in August 2019.
In addition, 53,000 permits were issued in August for buildings with 2 to 4 units. This was up 18 percent from the previous month and was 26 percent higher than the level in August 2019.
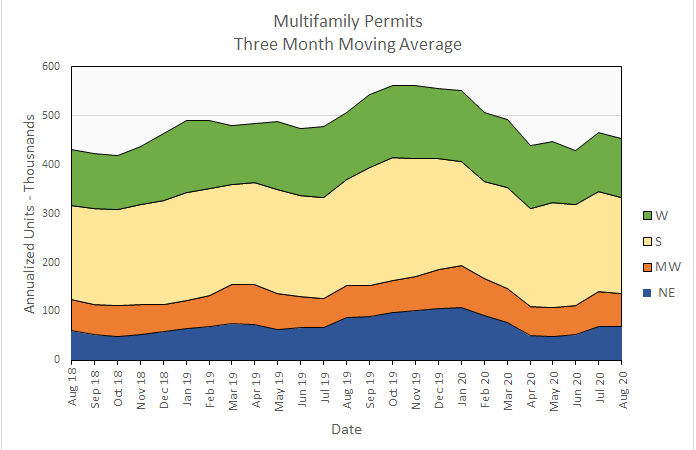
Regional data for multifamily housing is only reported for structures with two or more units. “Structures with 5 or more units” is not broken out as a separate category. Since the regional data is highly volatile and is frequently revised, it is examined here based on three-month moving averages. This averaging will tend to smooth out the effects of sudden shocks like the shutdowns in reaction to the COVID-19 pandemic.
Nationally, the three-month moving average for permits issued for multifamily housing in August was down 3 percent from the July level and was down 11 percent from the level of August 2019. This is shown in the first chart, below. The three-month moving average came it at 453,000 units, 10 percent below the trailing 12 month average.
On a month over month basis, permit issuance was nearly unchanged in the Northeast and the West and was down marginally in the Midwest and the South.
Compared to year-earlier levels, the three-month moving average of permits issued was up 6 percent in the Midwest, but was down 11 percent in both the South and the West and down 22 percent in the Northeast.
The following chart shows the three-month moving averages of permits by region for the last 25 months.
Multifamily housing construction starts drop
The blowout level of starts in buildings with 5 or more units reported for July was revised downward significantly to a still strong level of 503,000 units on a seasonally adjusted, annualized basis. The August figure came in at a respectable level of 375,000 units, down by 25 percent from the revised July figure. This was also 17 percent below the level of starts in August 2019.
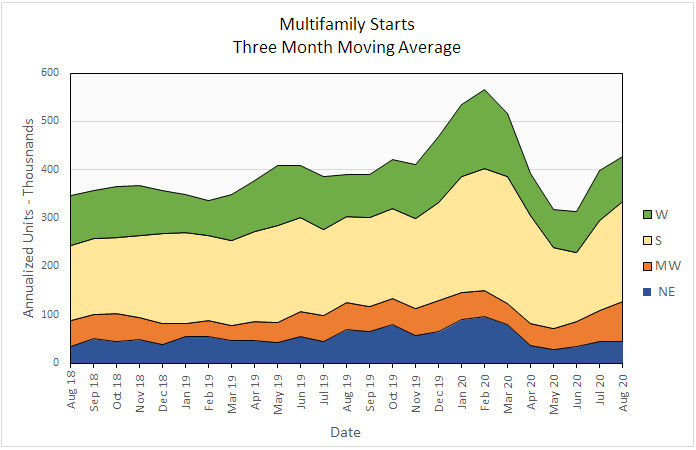
Multifamily housing construction starts (two or more units per building) in August were up 7 percent from their July levels for the country as-a-whole, based on three-month moving averages. Starts were up 31 percent in the Midwest and 10 percent in the South. Starts fell 1.5 percent in the Northeast and 9 percent in the West.
The three-month moving average of starts was up 9 percent for the country-as-a-whole on a year-over-year basis. Compared to August 2019, starts were up 50 percent in the Midwest, 16 percent in the South and 6 percent in the West. Starts fell 36 percent in the Northeast.
The following chart shows the starts by region for the last 25 months.
Completions also fall
The August report shows that completions in buildings with 5 or more units per building fell 15 percent to a figure of 312,000 units on a seasonally adjusted, annualized basis. Compared to August 2019, completions in buildings with 5 or more units per building were almost unchanged, falling 1 percent.
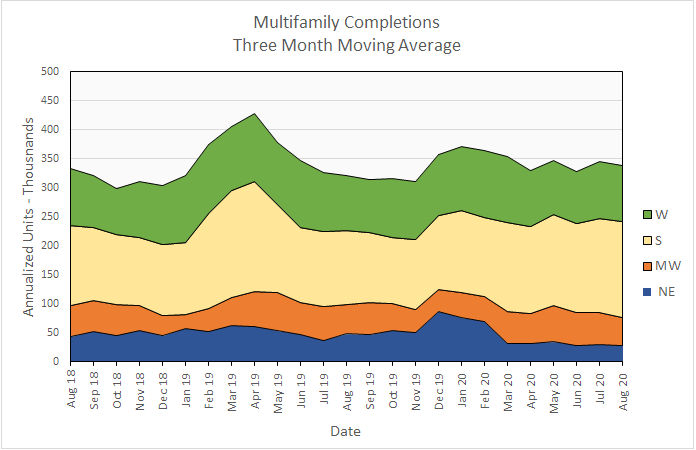
For the country as-a-whole, completions for multifamily housing (two or more units per building) were down 2 percent month-over-month, comparing three-month moving averages. By region, the three-month moving averages of completions were up 1 percent in the South but down 1 percent in the West, 7 percent in the Northeast and 10 percent in the Midwest. The three-month moving average of completions in the South represented 49 percent of those for the country as-a-whole.
On a year-over-year basis, the three-month moving average of completions in buildings with 2 or more units per building was up 6 percent nationally. Completions were up by 29 percent in the South and 4 percent in the West. Completions fell by 3 percent in the Midwest and by 42 percent in Northeast.
Completions by region for the past 25 months are shown in the chart below.
All data quoted are based on seasonally adjusted results and are subject to revision.


