

A pair of recent reports, one from CoStar and another from Real Capital Analytics (RCA), track the changes in values of commercial property in the United States. This article looks at the parts of the reports that deal with multifamily property values.
Defining the indices
The CoStar report focuses on a relative measure of property values called the CoStar Commercial Repeat Sales Index (CCRSI). Real Capital Analytics calls their equivalent measure the Commercial Property Price Index (CPPI). Both indices are computed based on the resale of properties whose earlier sales prices and sales dates are known. The indices represent the relative change in the price of property over time rather than its absolute worth.
Comparing multifamily to the rest
The first chart combines data from both reports to show how multifamily property values have changed over time relative to the values of other commercial property types. The data is normalized so that the index values for all property types are set to be 100 in December 2000. The change in the value of an index since then shows how the relative value of that property type has changed.
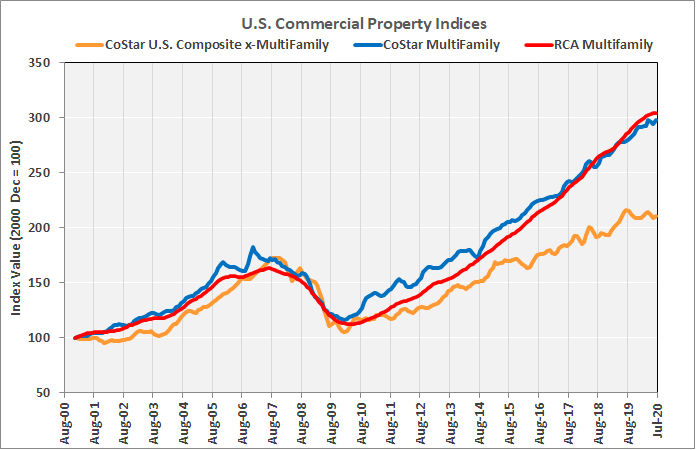
The chart shows that the both the value-weighted Costar index and the RCA index for multifamily property values have risen faster than the CoStar composite index for other commercial property types. This has been particularly true during the last few years. The chart also shows that the CoStar and RCA indices have been tracking each other very closely recently.
By the numbers
CoStar reported that the value-weighted CCRSI for multifamily properties was up by 1.4 percent for the month and up 7.0 percent over the last 12 months. RCA reported that the CPPI for multifamily properties was up 0.2 percent for the month and up 6.9 percent over the last 12 months.
CoStar reported that the value-weighted CCRSI for commercial property, excluding multifamily, was up 0.1 percent for the month but down 2.6 percent compared to its year-ago level. However, the CCRSI reading for July 2019 established a recent high so it set a high standard for comparisons.
RCA reported that the CPPI for commercial property was down 0.1 percent from last month but was up 0.9 percent over the last 12 months.
Both CoStar and RCA reported that transaction volume is down significantly from its level before the pandemic. CoStar also reported other indicators of softening in the market. These include a slight increase in the average time-on-market before a property sells, a slight fall in the sale-price-to-asking-price ratio and a slight increase in the share of properties taken off of the market by discouraged sellers.
The full CoStar report can be found here. The RCA report can be found here.


