Recent reports from CoStar and from Real Capital Analytics (RCA) show that multifamily property values continue to rise in September despite the pandemic.
Defining the indices
The CoStar report focuses on a relative measure of multifamily property values called the CoStar Commercial Repeat Sales Index (CCRSI). Real Capital Analytics calls their equivalent measure the Commercial Property Price Index (CPPI). Both indices are computed based on the resale of properties whose earlier sales prices and sales dates are known. The indices represent the relative change in the price of property over time rather than its absolute worth.
Prices hold up
RCA reported that multifamily property values overall increased 0.6 percent in September and were 6.7 percent higher than year-ago levels. RCA reports apartment sales volume was down 51 percent in Q3.
CoStar reported that its value-weighted index of multifamily property values increased 1.4 percent in September from its level in August. It was 8.6 percent higher than its level in September 2019.
Assessing distress
RCA reported that most apartment sales which have taken place in Q2 and Q3 have seen price appreciation; only 6 percent of transactions have been at a loss. RCA attributes this to the availability of capital for refinancing debt. This has allowed the owners of properties that have experienced distress to refinance rather than selling at a loss. While few distressed sales have taken place, RCA believes that commercial properties are sliding into trouble. They report that $40 billion in commercial properties became distressed in Q2, up from $5 billion in Q4 2019. However, hotels represented 50 percent of the inflow to distressed status and retail represented 42 of inflow.
CoStar reported that only 1.3 percent of commercial property sales in Q3 were for distressed properties. This is actually lower than the average rate of distressed property sales for the previous 12 months (1.7 percent). While CoStar only tracks new sales for properties for which they also have prior sales data, the number of tracked transactions in September rose by 5.5 percent from August. However, it remained 27 percent below the average level for 2019. At the same time, the dollar volume of transactions jumped by 82 percent in September over the August level, probably due to a few large transactions. Even so, the dollar volume of tracked sales in September remained 27 percent below the average monthly dollar volume in 2019.
An in-depth look
While CoStar reports transaction data monthly, they report much more detailed data at the ends of quarters. The most recent report supplies data through the end of Q3, and so it contains this extra detail.
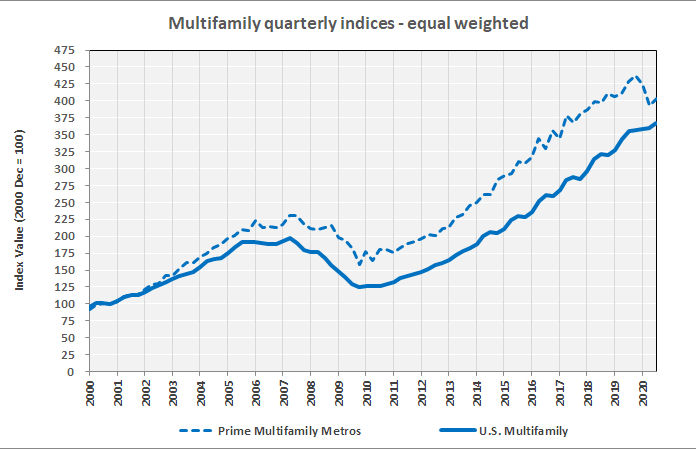
CoStar provides a quarterly report on the difference between the overall growth of multifamily property values and the price growth of multifamily properties in “prime” markets. Prime markets are generally in large, coastal metros, exactly the regions which have reportedly been hardest hit by the trend of people leaving the cities. This comparison is shown in the first chart, below. The chart shows that price appreciation for multifamily properties in the prime markets had been exceeding that for multifamily properties generally. However, in early 2020, as the COVID related disruptions to the economy began, prices of prime properties were hit harder. The latest quarter’s data indicates that price appreciation of the prime assets has resumed but, given the up and down nature of this measure of price appreciation, it will take a few more quarterly readings before we can say whether this is the start of a trend or whether it is just noise in the data.
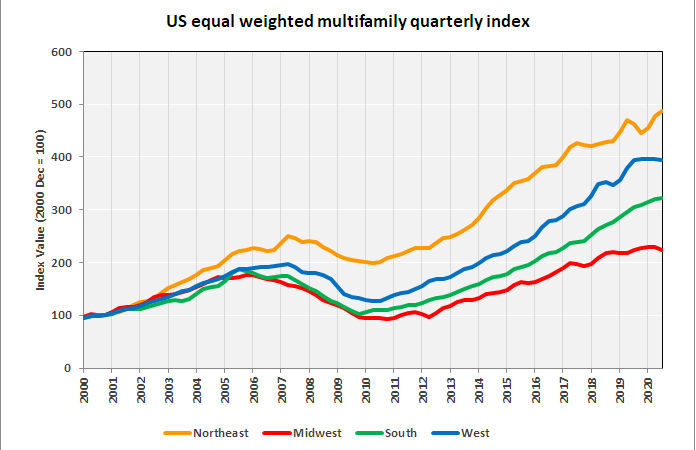
CoStar also provides regional property price appreciation data based on its equal-weighted index. Data for multifamily property values was collected and is shown in the next chart, below. Interestingly, the Northeast, which has reportedly been hard hit by COVID shows recent price appreciation. By contrast, the Midwest, which has been reported to be a safe-haven from COVID, shows some price weakness. The West, with its gateway cities and widespread lockdowns, also shows the expected price weakness. Prices in the South seem relatively unaffected by the pandemic.
The full CoStar report can be found here. The RCA report can be found here.


