

Freddie Mac recently released its Apartment Market Investment Index (AIMI) for Q4 2020. The national index was up 0.5 percent in the quarter and was 3.4 percent higher than its year-ago level, indicating an improving apartment investment environment.
Assessing the trends
For those unfamiliar with Freddie Mac’s AIMI, please see “Defining AIMI” below.
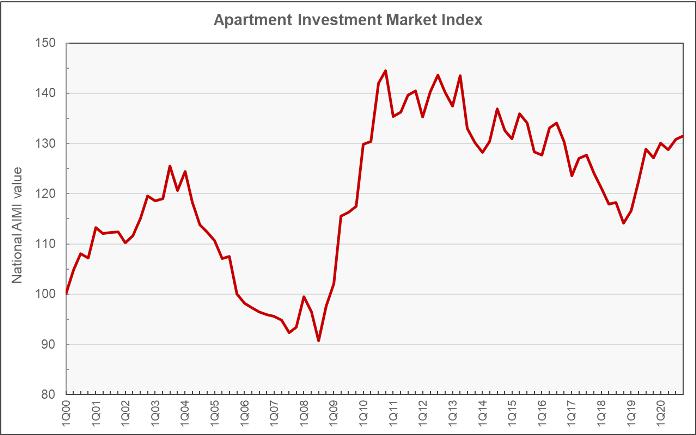
The national AIMI since 1Q 2000 is shown in the first chart, below. The chart shows that the national AIMI held up pretty well throughout 2020 despite the market disruptions caused by the COVID pandemic. Freddie Mac reports that the main factor supporting the apartment investment environment has been falling mortgage interest rates. These offset the effects of a slight drop in net operating income and a slight rise in property prices.
The following table shows the quarterly, annual and 5-year percentage changes for the AIMI in the cities tracked by Freddie Mac.
| Location | 1 Quarter AIMI change (percent) | 1 Year AIMI change (percent) | 5 Year AIMI change (percent) |
| Atlanta | 4.2 | 9.3 | 4.6 |
| Boston | -2.5 | -4.6 | -3.6 |
| Charlotte | 2.4 | 9.3 | 4.9 |
| Chicago | -0.9 | 5.6 | 16.5 |
| Dallas | 0.1 | -1.6 | -2.4 |
| Denver | -1.0 | 3.7 | -2.2 |
| Washington DC | -0.5 | -3.7 | 7.6 |
| Houston | 0.4 | 1.2 | 8.6 |
| Jacksonville | 5.7 | 18.2 | -2.0 |
| Las Vegas | 2.3 | 7.9 | -9.4 |
| Los Angeles | 2.0 | 2.4 | 1.8 |
| Miami | 4.0 | 4.1 | 5.4 |
| Minneapolis | 1.2 | 6.0 | 18.9 |
| Nashville | -0.7 | -1.1 | -2.2 |
| National | 0.5 | 3.4 | 2.4 |
| New York | -2.6 | -4.5 | -0.5 |
| Oakland | 0.6 | 1.6 | -10.9 |
| Orlando | 1.6 | 4.0 | -1.3 |
| Philadelphia | 3.1 | 9.0 | 23.6 |
| Phoenix | 2.3 | 2.1 | -4.0 |
| Portland | 1.5 | 6.7 | 2.6 |
| Raleigh | -0.6 | 2.0 | 8.0 |
| San Diego | 4.2 | 11.2 | 9.7 |
| San Francisco | -5.8 | -12.0 | -15.0 |
| Seattle | -3.0 | -0.5 | 0.8 |
| Tampa | 3.0 | 3.6 | -4.3 |
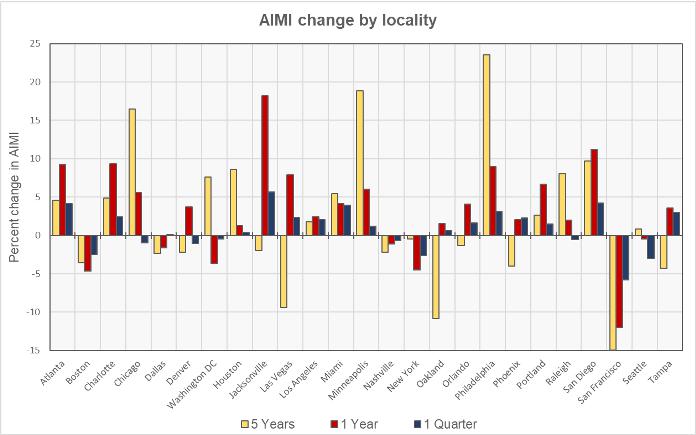
The cities with the greatest percentage increase in AIMI over the last year are Jacksonville, San Diego, Charlotte and Atlanta. The cities with the greatest percentage decline in AIMI over the last year are San Francisco, Boston, New York and Washington D.C.
The cities with the greatest percentage increase in AIMI from Q3 to Q4 are Jacksonville, San Diego, Atlanta and Miami. The cities with the greatest percentage decline in AIMI from Q3 to Q4 are San Francisco, Seattle, New York and Boston.
The city-by-city comparison of the changes in the AIMI is shown in the last chart, below.
Of course, the characteristics of individual properties are key to deciding whether to invest. However, if there is an apartment market of interest and if its AIMI is rising, it may be a signal that it is time to act.
Defining AIMI
Freddie Mac developed the AIMI as a quick way to assess the changing attractiveness of the apartment investment environment in a given market over time. It is derived from three market variables: the interest rate on multifamily mortgages, the growth rate in multifamily property prices and the growth rate in multifamily net operating income (NOI). The higher the value of the AIMI, the more attractive an investment in multifamily property is said to be. Higher growth in NOI results in a higher AIMI while higher multifamily mortgage interest rates or higher growth rates in multifamily property prices result in a lower AIMI.
Each quarter, Freddie Mac calculates a national AIMI and also local AIMI’s for 25 top metro areas. Since the AIMI for each metro area is normalized to a value of 100 for Q1 2000, the absolute values of the AIMIs for the different metros cannot be used as a measure of the comparative attractiveness of investments in multifamily housing between the metros. This is because the market conditions in each of the metros in Q1 2000 were different so each metro’s AIMI is calculated relative to a different baseline. However, the changes in the levels of the AIMI for any given metro are an indication of whether or not investment conditions are improving in that metro.


