

Recent reports from CoStar and from Real Capital Analytics (RCA) paint different pictures of short-term movements for multifamily property prices in February.
Defining the indices
The CoStar report focuses on a relative measure of property values called the CoStar Commercial Repeat Sales Index (CCRSI). Real Capital Analytics calls their equivalent measure the Commercial Property Price Index (CPPI). Both indices are computed based on the resale of properties whose earlier sales prices and sales dates are known. The indices represent the relative change in the price of property over time rather than its absolute price.
Multifamily prices up for the year
RCA reported that multifamily property prices in February were up 0.7 percent for the month and were 7.2 percent higher than their levels one year ago. This compares to a 6.8 percent annual increase for all commercial property types and an 8.1 percent annual increase for industrial property. Industrial property has had the highest rate of price appreciation recently of all commercial property classes according to RCA. By contrast, RCA found that prices for properties in the retail sector in February were 1.4 percent lower than their levels of a year ago, although they did rise 0.3 percent from January’s level.
CoStar reported that its value-weighted index of multifamily property prices fell 0.9 percent in February from its level in January. However, the index was 6.7 percent higher than its level in February 2020. By comparison, the value-weighted composite index for all commercial property types was down 1.4 percent for the month but up 3.9 percent from its year-earlier level.
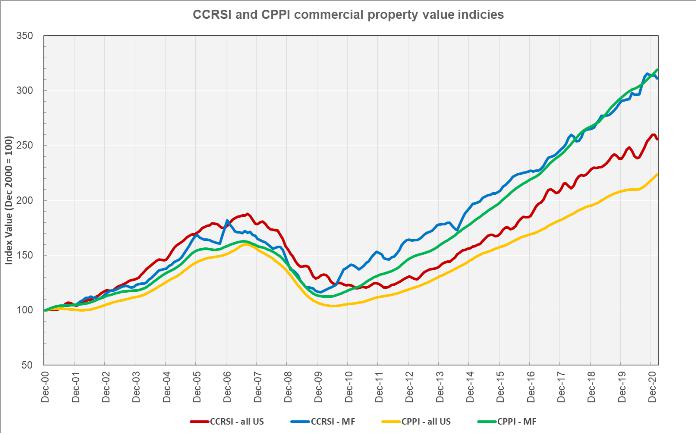
The history of the CCPIs and value-weighted CCRSIs for all commercial properties and for multifamily properties as asset classes are shown in the first chart, below. The relative smoothness of the CPPI lines compared to the CCRSI lines indicate that RCA does more post-processing of their data in calculating their index. The more pronounced short-term movements in the CCRSI lines are characteristic of less processed data. However, despite the short-term differences, the long-term trends of both data sets are very similar.
Transaction volume down
While they did not break out transaction volume by commercial property type, CoStar included information on overall commercial property sales transaction volumes on properties for which they have purchase information. CoStar found that the volume of transaction-pairs in the 12 months ending in February 2021 was down 20 percent from that of the 12-month period ending in February 2020. The number of trades in the 12 months to February 2021 was the lowest for a 12-month period since April 2013.
CoStar reported that distressed sales as a portion of all sales remained low in February, with rates for both general commercial and for investment grade properties running below their 5-year averages.
The full CoStar report can be found here. The RCA report can be found here.


