

A recent study by Yardi Matrix examined occupancy results over the past 12 months from 78,000 properties representing 14.4 million units. It found that occupancy declines over the past year are severe in some markets, but the distress is not widespread.
Overall, not so bad
The study categorized metropolitan areas by the degree to which the properties within them lost occupancy. It reported the average occupancy change for all properties in a metro and also the portion of properties within the metro that lost at least 5 percent occupancy and the portion that lost at least 10 percent occupancy. It examined these statistics for major metropolitan areas as a whole and also for individual regions within certain metros.
For the country as a whole, the report noted that occupancy was down only 0.2 percent year-over-year. Of the top 30 metros listed in the report, 14 saw their occupancies rise for the year. However, 7.8 percent of properties nation-wide saw their occupancy drop by 5 percent or more and 1.8 percent of properties saw occupancy drop by 10 percent or more.
For reference, Yardi Matrix has previously reported that rents in March were up 0.6 percent from their year-earlier levels. Pre-pandemic occupancy was at 94.9 percent nationally, a strong figure.
The biggest losers
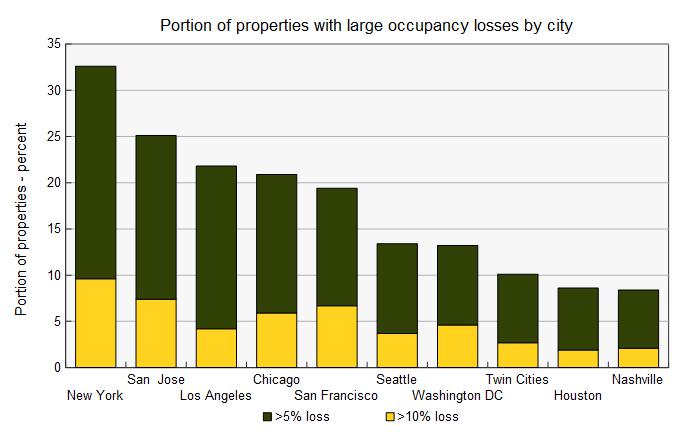
The metropolitan areas with the highest portion of properties experiencing significant declines in occupancy are show in the first chart, below. The metros most affected are generally expensive, gateway markets. As the amenities provided by these metros closed down and as working from home became commonplace, significant numbers of residents relocated to communities which offered more living space at lower cost.
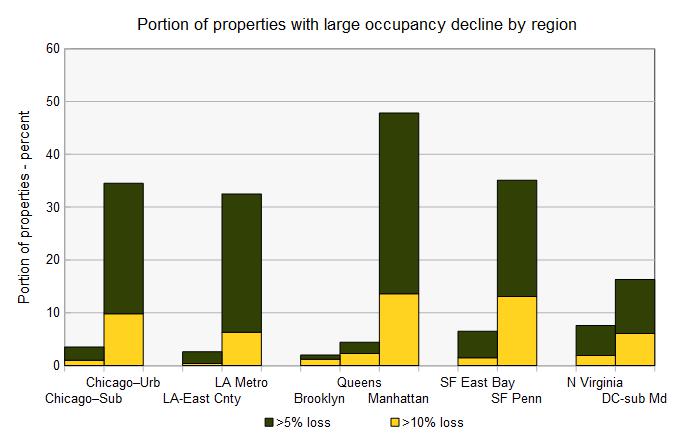
Even within these metros, the occupancy losses were concentrated in the core area. This is shown in the second chart, below. While the New York metro area saw nearly 33 percent of properties lose at least 5 percent occupancy, in Manhattan, 47.8 percent of properties experienced that level of occupancy loss. The situation was similar in Chicago, Los Angeles and San Francisco, with properties in the city core being much more impacted than those in the near-in suburbs. Part of the reason for this may be that the near-in suburbs were the recipients of many of the residents abandoning the urban core.
Coming back
The report takes a stab at predicting how the top market will perform in the years ahead. These predictions include when they will return to pre-pandemic levels of occupancy and rent, as well as their cumulative rent growth over the next 5 years. The good news is that in 19 of the top 30 metros, rents are already at pre-pandemic levels. Yardi Matrix predicts that only one metro will take more than 5 years for rents to recover to pre-pandemic levels: New York.
The situation for a return to pre-pandemic occupancy levels is less positive. The report lists 8 metros where it expects this process to take more than 5 years. They are New York, San Jose, San Francisco, Los Angeles, Chicago, Orlando, Twin Cities and Miami metro.
The Yardi Matrix report contains tables of data presenting its findings. It also includes interesting charts relating occupancy drops to current occupancy and to rent growth. The report is available here.


