

The Census Bureau’s report on construction spending shows that the value of residential construction put in place in March was up 1.7 percent from February’s level despite a small drop in the multifamily category. Overall construction spending was up 0.2 percent for the month and was 4.5 percent higher than its level in March 2020.
Residential construction spending up overall
The preliminary report on total private residential construction put in place in March 2021 came in at $725 billion on a seasonally adjusted, annualized basis. This figure, which includes spending on both new construction and on improvements, was up 23 percent from the level of March 2020.
The value of new multifamily residential construction put in place in March came in at $93.5 billion on a seasonally adjusted, annualized basis. This was down 0.3 percent from the revised level for February. However, the value of multifamily residential construction put in place in March 2021 was 14.6 percent higher than the level of March 2020.
The value of new single-family residential construction put in place in March was $389.9 billion on a seasonally adjusted, annualized basis. This was up 2.0 percent from the revised level for February and was up 26.7 percent from the level of March 2020.
The value of improvements to residential buildings put in place in March came in at $241.9 billion on a seasonally adjusted, annualized basis. This was up 2.0 percent from the revised level for February and was up 21.7 percent from the level of March 2020. The Census Bureau does not indicate whether improvements were for single-family or for multifamily residential buildings.
Visualizing the data
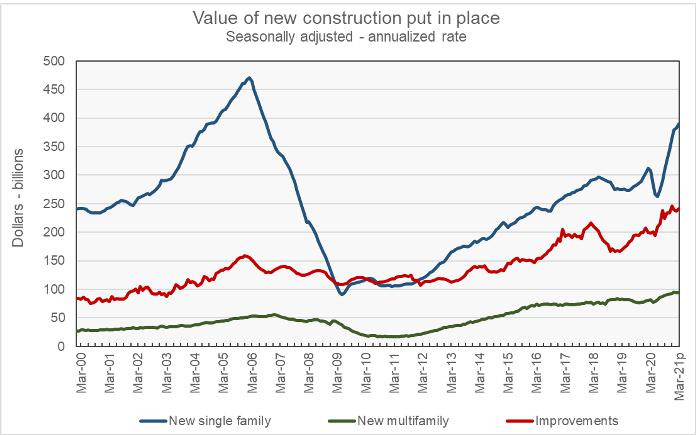
The first chart, below, shows the history of new residential construction spending since January 2000 for single-family, multifamily and improvements. Spending on both single-family and multifamily housing were much more impacted by the housing crash than was spending on improvements. Even the recent surge in spending on single-family homes has not brought its level back to that at the peak of the housing bubble in 2005. However, spending on both multifamily housing and on residential improvements have rebounded to well above their levels in 2005.
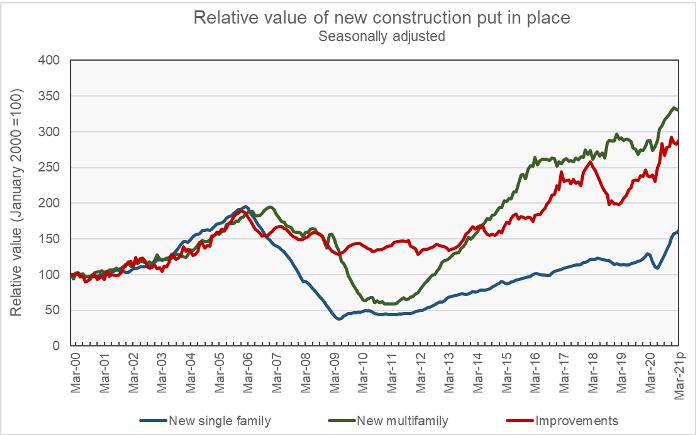
The second chart plots the same data, but it normalizes the spending levels so that the readings for January 2000 are 100 in each case. This view of the data makes it clear that spending on improvements was much less impacted in the 2010 to 2013 time frame after the bursting of the housing bubble than was spending on either new multifamily housing or new single-family housing. It also shows the degree to which spending on single-family residential construction has not recovered from the housing bust compared to other residential construction spending.
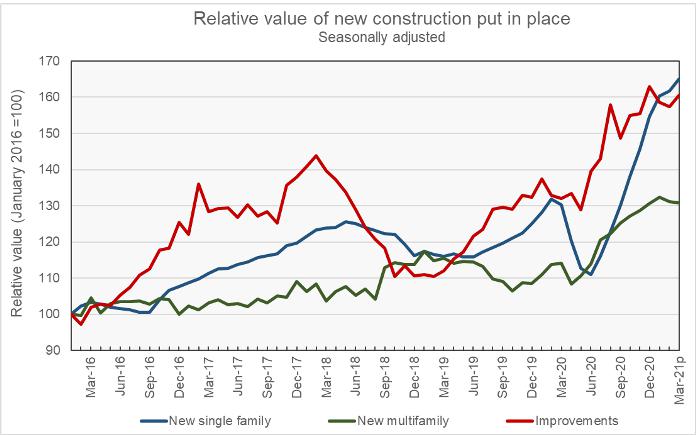
The final chart focuses on the time period since January 2016. In this chart, the value of the construction put in place for the three categories of residential construction are normalized so that the readings for January 2016 equal 100. This shows more clearly how residential construction spending changed in response to the pandemic. In general, spending dropped after lockdowns began to be imposed in the March-April 2020 timeframe only to surge later in the year. This pattern is strongest for single-family construction and least strong for multifamily residential construction.
The report from the Census Bureau also includes information on spending on other types of construction projects. The full report can be found here.


