A recent report from CoStar indicates that multifamily property prices are maintaining steady growth on a year-over-year basis.
Defining the indices
The CoStar report focuses on a relative measure of property prices called the CoStar Commercial Repeat Sales Index (CCRSI). The index is computed based on the resale of properties whose earlier sales prices and sales dates are known. The index represents the relative change in the price of property over time rather than its absolute price.
Prices continue their rise
CoStar reported that its value-weighted index of multifamily property prices increased 7.7 percent, year-over-year, in April 2021. The index was up 1.2 percent month-over-month.
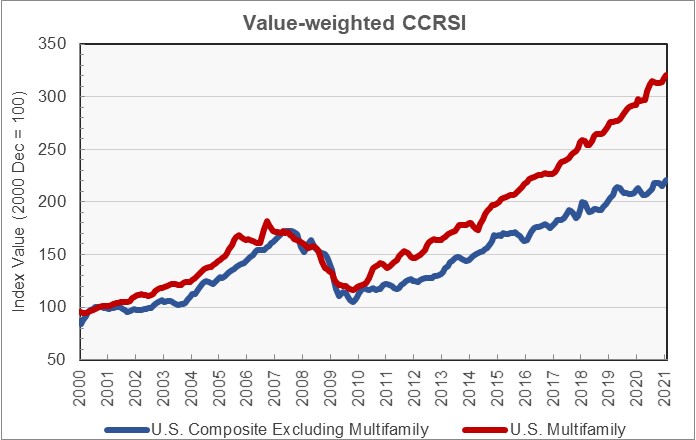
The first chart, below, plots the long-term changes in the CoStar CCRSI for both multifamily property and for all other commercial property types considered as a group. The chart shows that multifamily property prices have outpaced those of other commercial property types. However, it should be noted that there is sizeable variation between the performances of different commercial property types included in the composite index.

For reference, the combined index of non-multifamily commercial property rose by 3.8 percent, year-over-year, in April. The index was up 1.5 percent month-over-month.
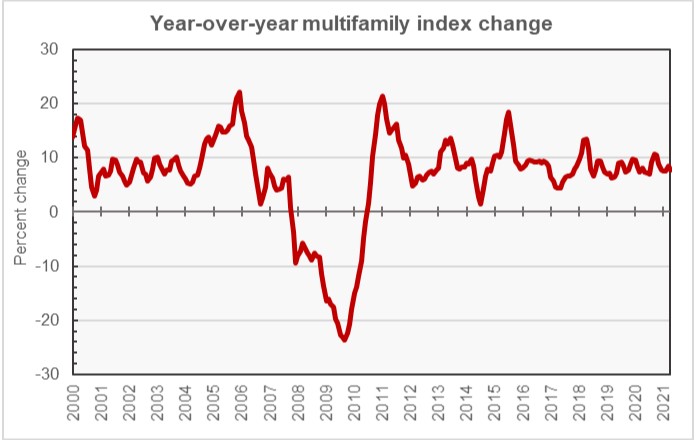
The second chart, below, shows the year-over-year change in the multifamily property price index since January 2000. Looking at the data on a year-over-year basis smooths out the high degree of variation in the monthly data, allowing underlying trends to be seen. Since May 2018, the year-over-year change in the multifamily price index has remained between +6.2 percent and +10.7 percent, a relatively narrow range when compared to other time periods since 2000.

Transactions returning to normal
CoStar reported that number of repeat-sale transactions was 18 percent higher in the first four months of 2021 than in the first four months of 2020, a sign that market conditions are returning to normal. The report also noted that both the portion of sales that were “distressed” as well as the average number of days a property was on the market before sale were running below their 5-year averages in April. Sellers in April received 92.7 percent of their asking prices.
The full reports provides significant additional information on transaction volumes, but it does not break out multifamily transactions. The CoStar report can be found here.


