

A Mortgage Bankers Association (MBA) report on multifamily and commercial mortgage debt shows that the GSEs accounted for 80 percent of the increase in multifamily mortgage debt outstanding in Q1. While still high, this share is down significantly from their share of the increase in debt in the last two quarters.
Unlike the MBA report on the mortgage origination index, which only gives a relative sense of the level of new mortgages being created, this report gives the net dollar value of mortgages outstanding.
The MBA reported that multifamily mortgage debt outstanding rose by $28.8 billion in Q1 2021, down from the $41.8 billion increase in Q4 2020. Total debt rose by 1.7 percent in the quarter, reaching a level of $1.72 trillion. Debt was up $142 billion (9 percent) year-over-year.
The total of all commercial mortgage debt, including multifamily debt, outstanding at the end of Q1 rose 1.1 percent from its Q4 level to $3.93 trillion. Multifamily mortgage debt represented nearly 44 percent of commercial mortgage debt outstanding.
Dominating the market
The shares of multifamily mortgage debt held by various classes of suppliers are shown in the first chart, below.
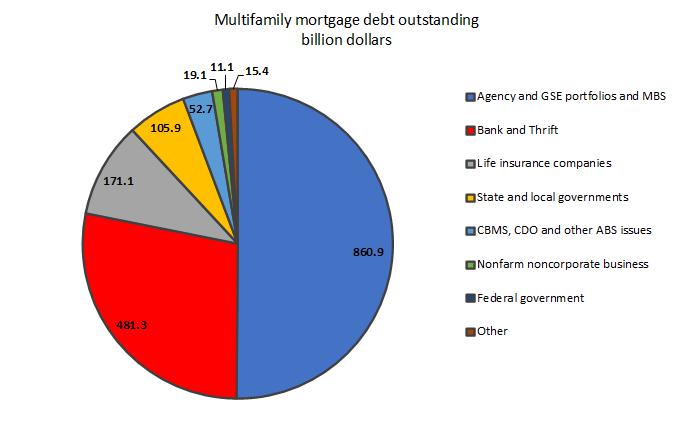
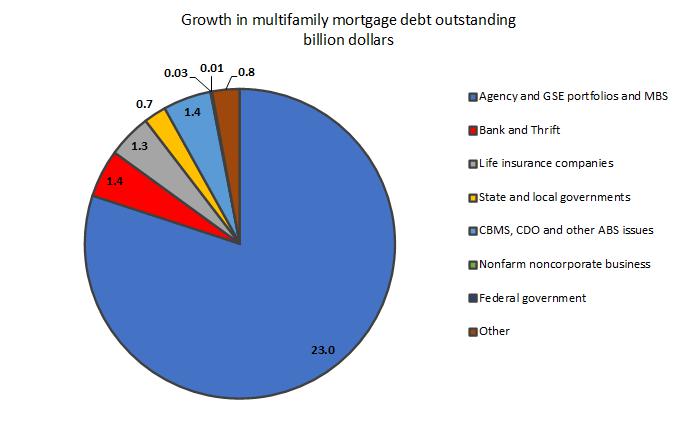
Of the increase in multifamily mortgage debt outstanding in the quarter, $23 billion, was held by “Agency and GSE portfolios and MBS”. These are agencies, like the Federal Housing Administration and Government Sponsored Enterprises (GSEs) like Fannie Mae and Freddie Mac, who buy up mortgages and sell some of the debt as Mortgage-Backed Securities (MBS). At the end of Q1, the GSEs holdings of multifamily mortgage debt rose to 50.1 percent of the total outstanding. This is up from their 47.9 percent share in the same quarter, last year.
Banks and Thrifts, the second largest holders of multifamily mortgages, increased their multifamily mortgage holdings by $1.44 billion during Q1. However, their share of outstanding debt slid again in Q1, falling to 28.0 percent.
Life insurance companies’ share of the multifamily mortgage debt outstanding was also reported to slide in Q1, falling to 10.0 percent. However, this was only a slide because their share of debt outstanding last quarter was revised upward from 9.9 percent to 10.1 percent. Life insurance companies increased their direct debt holdings by $1.44 billion in Q1 compared to the revised level from the prior quarter, reaching a level of $171.1 billion. However, this figure does not account for the debt these companies hold through commercial mortgage-backed securities (CMBS).
State and local governments held 6.2 percent of outstanding multifamily mortgage debt at the end of Q1, down 0.1 percent. Their holdings totaled $105.9 billion at the end of the quarter.
CMBS, CDO (collateralized debt obligations) and other ABS (asset backed securities) issues increased their holdings of multifamily mortgage debt in Q1 by $1.44 billion despite the Q4 figure being revised upward by $387 million. However, their share of debt outstanding fell to 2.8 percent.
Reducing exposure
The other issuers of multifamily mortgage debt listed by the MBA hold 2.6 percent of outstanding debt. All of them except REITs saw their share of outstanding debt fall. REITs’ holdings rose $958 million in the quarter. This is on top of the $760 million increase in their holding reported for last quarter. Over the last two quarters, their holdings have increased by 37 percent and their share of debt holdings rose from 0.29 percent to 0.38 percent.
The next chart, below shows the increase in outstanding multifamily mortgage debt by lender type in Q1. The growing market share of the lenders with implicit government backing is clear by the size of the pie slice which represents their holdings increase.
The report does not cover loans for acquisition, development or construction, or loans collateralized by owner-occupied commercial properties. The report also includes information on mortgage debt outstanding for other commercial property types. The full report can be found here.


