

A report from Real Capital Analytics (RCA) said that multifamily property prices rose 12 percent in the year to June, topping the rates of price growth for the other commercial property types they track. This is the largest year-over-year increase in multifamily property prices in 6 years.
Defining the index
Real Capital Analytics tracks an index they call the Commercial Property Price Index (CPPI). The index is computed based on the resale prices of properties whose earlier sales prices and sales dates are known. The index represents the relative change in the price of property over time rather than its absolute price.
Prices on the rise
RCA reported that multifamily property prices in June were up 1.4 percent for the month. This was the highest price appreciation of the five commercial property types tracked by RCA and it compares to a 0.8 percent monthly and an 9.8 percent annual price increase for all commercial property types.
Price appreciation for industrial properties was 0.8 percent for the month and 9.8 percent over the past 12 months. Office buildings within central business districts (CBDs) were again the worst performing sector with a price decline of 2.4 percent over the year. However, offices within CBDs managed to eke out a 0.1 percent price rise for the month. All offices as a single asset class experienced price growth of 6 percent for the year while retail properties saw their prices rise by 3.2 percent since June 2020.
Taking the long view
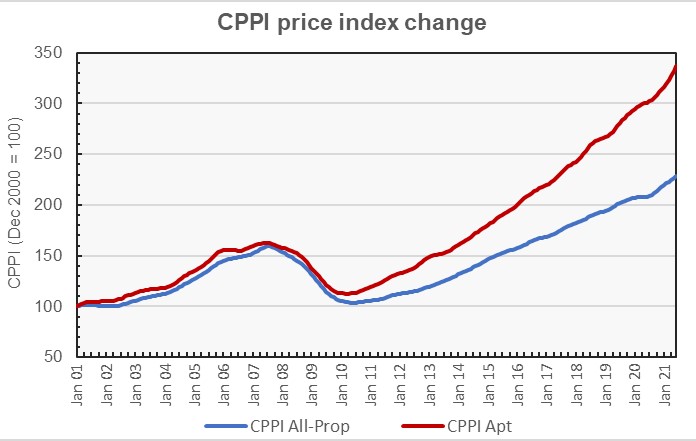
The first chart, below, plots the long-term changes in the RCA CPPI for multifamily properties and for all commercial property as an asset class. It shows that multifamily property prices have risen at a faster pace than those of other commercial property types since the recovery from the 2007 housing crash.
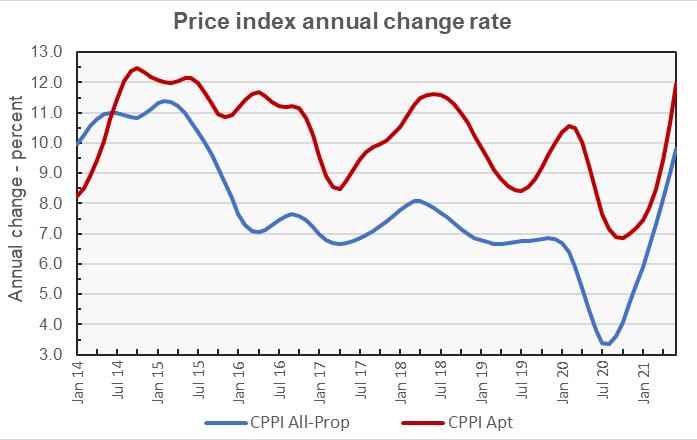
The second chart, below, takes some of the same data but plots it as the year-over-year change in the values of the indices. It shows the clear outperformance of multifamily property over the last 6 years, and even through the pandemic. The chart also shows that the annualized rate of property price growth for all commercial property viewed as a single asset class was remarkable steady between January 2016 and January 2021.
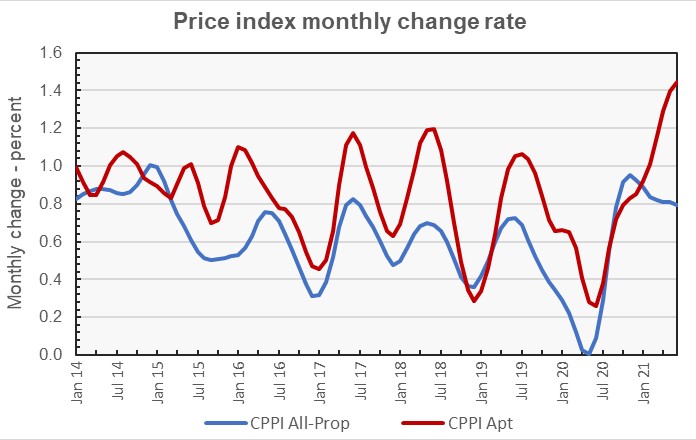
The next chart takes another look at the data, this time focusing on the monthly rate of property price changes. This chart shows the pattern of annual changes in the rate of price appreciation for commercial property and how that pattern was broken in 2020. It also shows that the monthly price growth rate for multifamily property may be reaching a peak, while that for commercial property as-a-whole has been relatively steady for the last 4 months.
Major metros lag
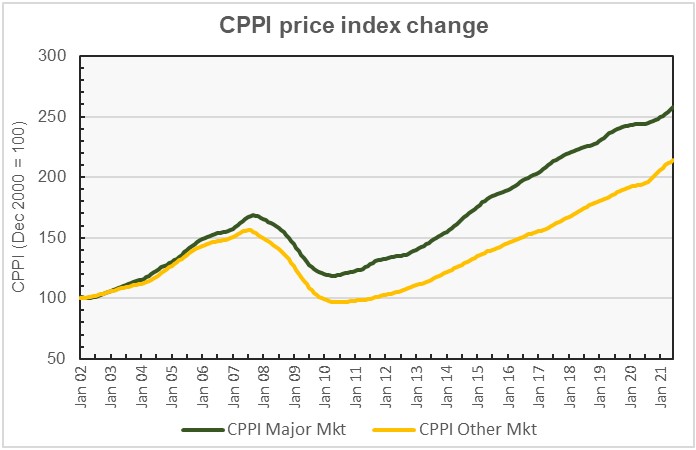
The RCA report provides data comparing the price changes of commercial property in 6 major metro areas* against those in the rest of the country, although it does not separate out apartments from other commercial property types in this comparison. The next chart, below, shows the long-term pricing trends for the major markets and for other markets tracked by RCA. Clearly, commercial property prices in the major metros as defined by RCA have outpaced those in other markets over the last 20 years.
The last chart, below, looks at the same data based on the rate of price increases over the prior 12 months. While the outsized impact of the pandemic in “gateway” markets has been frequently discussed, this chart shows that the commercial property price increases in the rest of the country have outpaced those in the 6 major metros since February 2018, well before the pandemic. The recent differential in year-over-year price appreciation is near 5 percent and is near the highest level seen in the period covered by the chart.
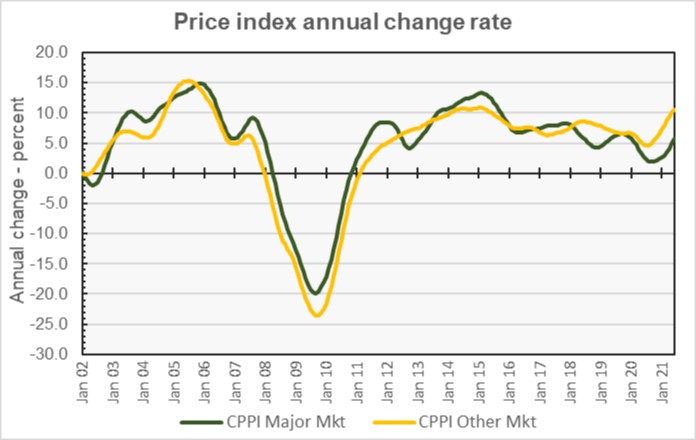
By the numbers, price appreciation for commercial property in major markets was reported to be 0.8 percent for the month and 5.7 percent for the year. Price appreciation for commercial property in non-major markets was reported to be 0.7 percent for the month and 10.5 percent for the year
The full report provides more detail on other commercial property types. Access to the RCA report can be obtained here.
*The major metros are Boston, Chicago, Los Angeles, New York, San Francisco and Washington DC.


