

The week 33 release of the Census Bureau’s Pulse Survey shows that the portion of renters who are behind on their rent payments is up since we last reported on the survey results.
Note that an earlier version of this article has been update to reflect the release of week 33 data.
What is the Pulse Survey?
The Pulse Survey is an experimental program that the Census Bureau has been running to assess how the population of the country is reacting to the fallout from COVID-19. The current survey, designated Week 33, collected data from June 23 through July 5.
This survey asks a variety of questions about how the respondent is coping financially including questions about paying for housing. A difficulty in using the survey is that the results are presented based on the number of adults (18+) responding in a certain way, not on the number of households. Different households could have different numbers of adult members. When looking at housing, a view from the perspective of households might have made more sense.
One of the questions that the Pulse Survey asks of renters is whether they are current on their rent. While some say that they occupy their housing without paying rent and some did not report whether they are current on their payments, the majority of respondents answered the question Yes or No.
The portion of respondents who pay rent saying that they are not current has varied from survey to survey. The first chart, below, shows the history of responses to this question. The data is plotted as a three-month weighted moving average in order to smooth out some of the irregularities in the curves.
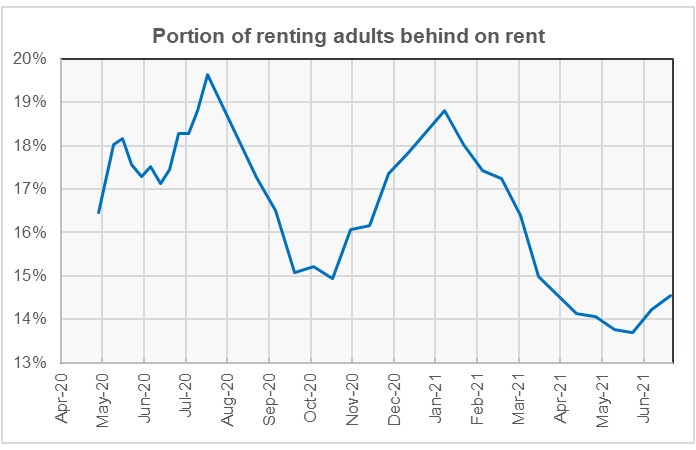
From the beginning of the Pulse survey until July 2020, 4 possible answers to the question of whether the respondent was current on the rent were offered. They were that the respondent did not have to pay rent, that he was current, that he was behind or that his rent had been deferred. For more recent surveys, the fourth answer was eliminated. However, in preparing the chart, those answering that their rent had been deferred were reported as being behind on their rent.
For reference, the NMHC rent tracker showed that 95.6 percent of renters at 11.7 million professionally managed apartments had made at least a partial rent payment for June by the end of the month. Note that, making a partial payment does not mean that the renter is current.
The data shows the delinquency rate rose early in the pandemic as the lockdowns were imposed. Delinquencies fell in the late summer-early fall when the restrictions were eased as the pandemic abated. Delinquencies then rose again in the fall as closures were re-imposed in response to the second COVID wave before declining this year as infections fell and the vaccine roll-out began.
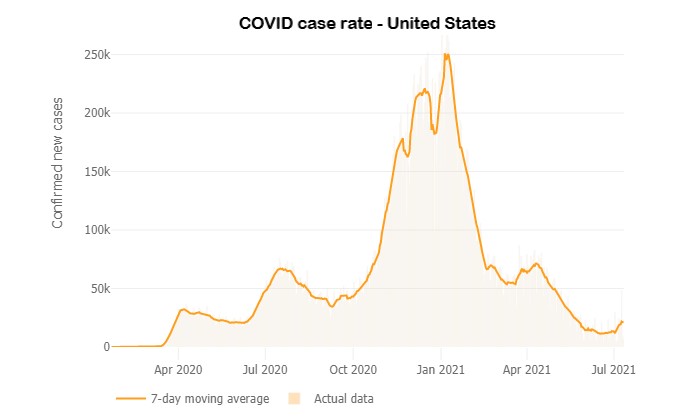
The confirmed COVID case rate for the United States is show in the next chart, below. Note that testing for the virus was not readily available when the first wave of the pandemic arrived in the spring of 2020, so the number of confirmed cases during that period is likely understated. The rent delinquency rate seems to follow the COVID case rate, with a short delay.
Profiling the participants
The Pulse Survey asked a series of questions to determine the characteristics of the different households responding to the survey. One question was how many people are in the household. The responses are shown in the first chart, below. The bars show the percentage of respondents within a particular category (current or not current on rent) who responded a certain way.
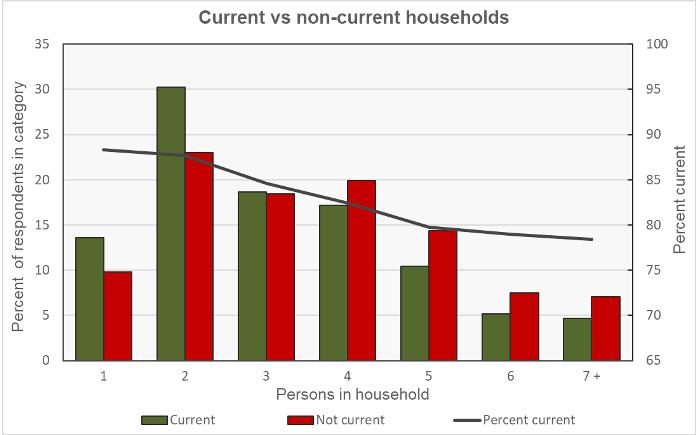
This chart is a little busy so here is an example of how to read the data for a two-person household: the bars on the chart show that about 31 percent of adults who were current on their rent resided in two-person households. About 23 percent of adults who were not current on their rent resided in two-person households. In either case, the two-person household could consist of one adult and one child or it could consist of two adults; the survey does not differentiate between them. The right-hand scale and the black line indicate that about 89 percent of adults residing in two-person households were current on their rent.
The chart shows that households with more people are generally more likely to be behind on their rent.
Of the respondents who reported being current on their rent, 38 percent said that they had children in the household. Of those reporting being behind on the rent, 53 percent reported having children in the household.
Of the respondents who reported being current on the rent, 64 percent said that they were employed, but 22 percent reported that a household member had experienced a loss of employment income. Of those reporting being behind on the rent, 49 percent said that they were employed, while 51 percent reported that a household member had experienced a loss of employment income.
The final chart shows the current/not current status of the respondents by household income level. As in the first chart, the bars show the percentage of adults within a particular category (current or not current on the rent) who reported having a certain household income level.
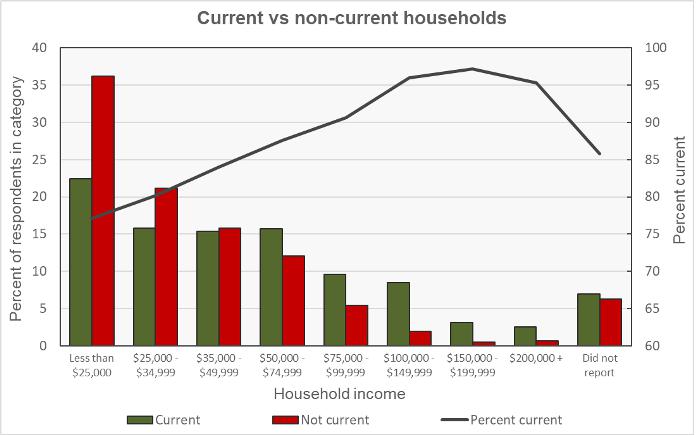
An example of reading this chart for the “Less than $25,000” category is that about 24 percent of responding adults who were current on their rent reported living in households with incomes of less than $25,000. About 33 percent of adults who were behind on their rent reported living in households whose income was less than $25,000. The black line is read on the right-hand scale. It indicates that about 80 percent of adults living in households earning less than $25,000 reported that they were current on their rent.
Generally a higher percentage of adult respondents who were behind on their rent reported having lower incomes. However, it is interesting to note that the portion of renters with household incomes in the $200,000+ category who are current on their rent than is lower than the portion of renters in the $100,000 to $150,000 category who are current.


