

The week 34 release of the Census Bureau’s Pulse Survey shows that the portion of renters who are behind on their rent payments is down slightly over the last month. In addition, the NMHC rent payment tracker reported that 80.2 percent of renters made at least a partial rent payment by August 6, up from the 76.5 percent who had made a payment by July 6.
What is the Pulse Survey?
The Pulse Survey is an experimental program that the Census Bureau has been running to assess how the population of the country is reacting to the fallout from COVID-19. The current survey, designated Week 34, collected data from July 21 through August 2. The renter portion of the survey covers renters of both multifamily and of single-family properties.
This survey asks a variety of questions about how the respondent is coping financially including questions about paying for housing. A difficulty in using the survey is that the results are presented based on the number of adults (18+) responding in a certain way, not on the number of households. Different households could have different numbers of adult members. When looking at housing, a view from the perspective of households might have made more sense.
One of the questions that the Pulse Survey asks of renters is whether they are current on their rent. While some say that they occupy their housing without paying rent and some did not report whether they are current on their payments, the majority of respondents answered the question Yes or No. The portion of respondents who pay rent saying that they are not current has varied from survey to survey. The first chart, below, shows the history of responses to this question.
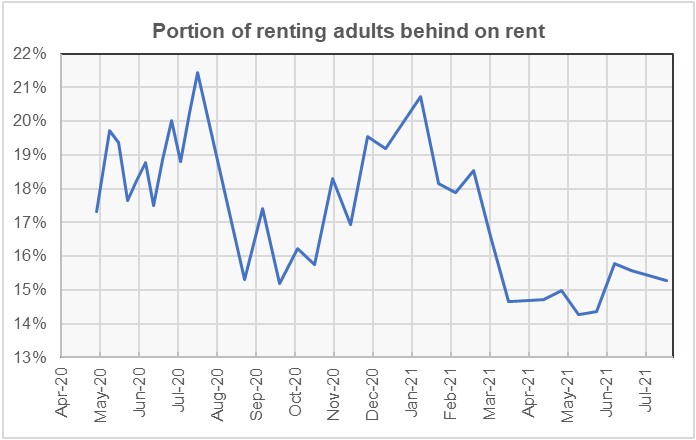
From the beginning of the Pulse survey until July 2020, respondents were able to report that their rent was deferred, but this possible answer was eliminated from more recent surveys. In preparing the chart, those answering that their rent had been deferred were included with those who reported as being behind on their rent. Also, people reporting that they occupied their dwelling without paying rent, which has varied between 4.5 percent and 6.9 percent of respondents, were not included in calculating the portion of renters who are behind on their rent.
The chart shows that the portion of renters who are behind on their rent is down significantly from the levels reached earlier in the pandemic. The portion behind ticked up from the low of 14.3 percent reached in mid-May to 15.8 percent in mid-June but has trended down since then.
Rent tracker finds good news and bad news
The NMHC rent tracker recently reported that 94.9 percent of renters at 11.7 million professionally managed apartments had made at least a partial rent payment for July by the end of the month. This was down from the 95.6 percent of renter who had made a least a partial payment by the end of June. Note that, making a partial payment does not mean that the renter is current. The rent tracker data for both end-of-month payment rate and 6th-of-month payment rate is shown in the next chart, below.
![]()
The chart plots the data from April through March. This is because April is when the effects of the pandemic and the related lockdowns were first felt, so the chart shows COVID years rather than calendar years. Data for the 12 months pre-COVID are included and well as data for the months since the start of the pandemic.
The chart shows that a significant portion of renters did not pay their rent, even pre-COVID. The 12-month average portion of renters who had not made a least a partial rent payment by the end of the month in the pre-COVID year was 3.8 percent. This rose to 5.4 percent in COVID year 1. The year-to-date month-end nonpayment figures are 3.3 percent pre-COVID, 4.7 percent in COVID year 1 and 5.0 percent in COVID year 2.
The units covered by the rent tracker represent only about 29 percent of the approximately 40 million occupied rental housing units in the United States. Many of the rental units not covered by the rent tracker are multifamily properties owned by smaller operators, and many more are single family rentals.
Profiling the participants
The Pulse Survey asked a series of questions to determine the characteristics of the different households responding to the survey. One question was how many people are in the household. The responses are shown in the next chart, below. The bars show the percentage of respondents within a particular category (current or not current on rent) who responded a certain way.
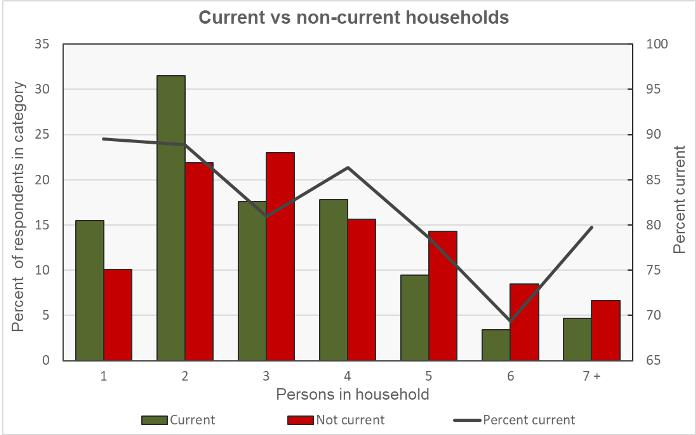
This chart is a little busy so here is an example of how to read the data for a two-person household: the bars on the chart show that about 31 percent of adults who were current on their rent resided in two-person households. About 22 percent of adults who were not current on their rent resided in two-person households. In either case, the two-person household could consist of one adult and one child or it could consist of two adults; the survey does not differentiate between them. The right-hand scale and the black line indicate that about 89 percent of adults residing in two-person households were current on their rent.
What the chart shows is that households with more people are generally more likely to be behind on their rent. The seven-person household is an exception to this rule. This may be due to this category having more working adults in the household relative to the number of children, but the data is not available on this point.
Of the respondents reported being current on the rent, 34 percent said that they had children in the household. Of those reporting being behind on the rent, 52 percent reported having children in the household.
Of the respondents who reported being current on the rent, 62 percent said that they were employed, but 21 percent reported that a household member had experienced a loss of employment income. Of those reporting being behind on the rent, 42 percent said that they were employed, while 48 percent reported that a household member had experienced a loss of employment income.
The final chart shows the current/not current status of the respondents by household income level. As in the first chart, the bars show the percentage of adults within a particular category (current or not current on the rent) who reported having a certain household income level. Not surprisingly, a much higher percentage of adult respondents who were behind on their rent reported having lower incomes.
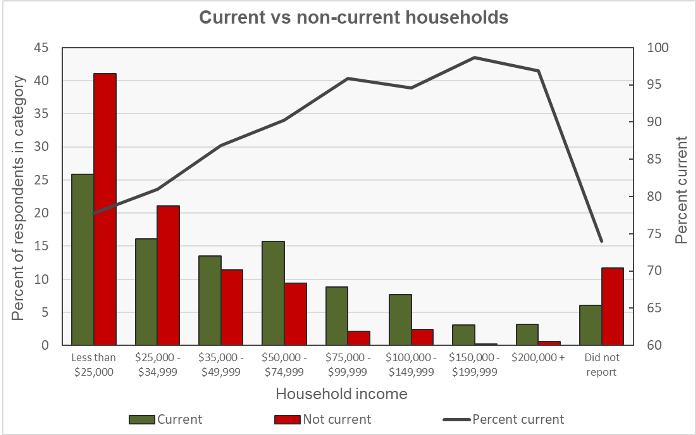
An example of reading this chart for the “Less than $25,000” category is that about 25 percent of responding adults who were current on their rent reported living in households with incomes of less than $25,000. About 41 percent of adults who were behind on their rent reported living in households whose income was less than $25,000. The black line is read on the right-hand scale. It indicates that about 78 percent of adults living in households earning less than $25,000 reported that they were current on their rent.


