A Mortgage Bankers Association (MBA) report on commercial and multifamily mortgage debt shows that the GSEs continued to be the largest source of net new multifamily mortgage funds in Q2. However, for the first time in a long time, their share of outstanding debt did not rise during the quarter.
The MBA reported that multifamily mortgage debt outstanding rose by $23.8 billion in Q2, down from the $28.8 billion increase in Q1. The debt rose by 1.4 percent in the quarter, reaching a level of $1.741 trillion. The mortgage debt was up $123 billion (7.6 percent) year-over-year.
The total of all commercial mortgage debt, including multifamily debt, outstanding at the end of Q2 rose 1.5 percent from its Q1 level to $3.98 trillion. Multifamily represented 44 percent of commercial mortgage debt outstanding.
Note that the earlier report on multifamily mortgage originations showed that the rate of new multifamily mortgage issuance in Q2 was up significantly from that in Q1. The fact that the level of multifamily mortgage debt outstanding in Q2 grew more slowly than in Q1 despite the higher issuance implies that a lot of mortgage debt was retired during Q2.
Dividing the market
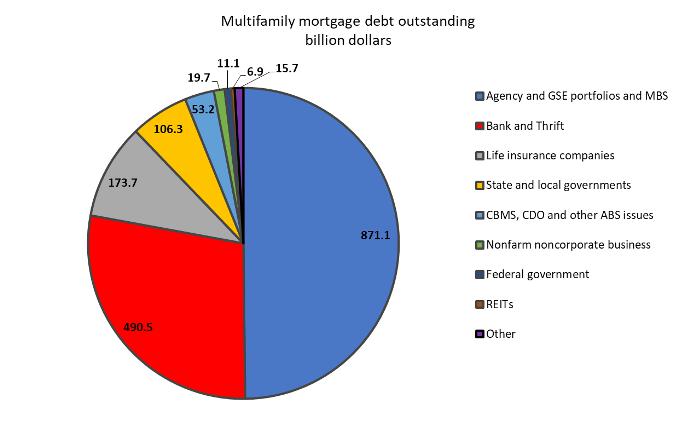
The shares of multifamily mortgage debt held by various classes of providers are shown in the first chart, below.

Of the increase in multifamily mortgage debt outstanding in the quarter, $10.2 billion was held by “Agency and GSE portfolios and MBS”. These are agencies, like the Federal Housing Administration and Government Sponsored Enterprises (GSEs) like Fannie Mae and Freddie Mac, who buy up mortgages and sell some of the debt as Mortgage-Backed Securities (MBS). At the end of Q2, the GSEs’ holdings of this debt fell slightly to 50.0 percent of the total outstanding.
Banks and Thrifts, the second largest holders of multifamily mortgages, increased their holdings by $9.94 billion during Q2, nearly 7 times the increases in each of the two most recent quarters. Their share of outstanding multifamily mortgages rose to 28.2 percent from their 28.0 percent share last quarter.
Life insurance companies’ share of the multifamily mortgage debt outstanding was effectively unchanged in Q2, remaining at 10.0 percent. Life Insurance companies increased their direct holdings by $2.54 billion in the quarter, raising their total holdings to $173.7 billion. However, this figure does not account for the debt these companies hold through commercial mortgage-backed securities (CMBS).
State and local governments held 6.1 percent of outstanding multifamily mortgage debt at the end of Q2, down 0.1 percent. Their holdings totaled $106.3 billion at the end of the quarter.
CMBS, CDO (collateralized debt obligations) and other ABS (asset backed securities) issues increased their holdings of multifamily mortgage debt in Q2 by $489 million. Their share of the debt outstanding remained at 3.1 percent.
REITs are not a major holder of multifamily mortgage debt with a 0.4 percent share, but they have been increasing their holdings at a rapid rate in recent quarters. They added $391 million to their holding in Q2 after adding $958 million in Q1.
Growing their share
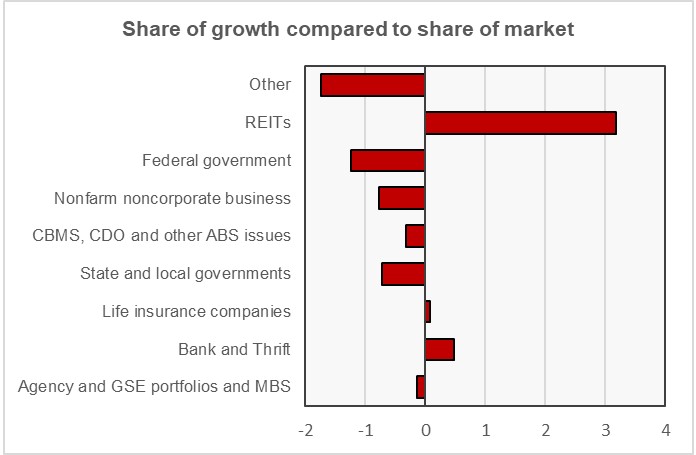
The next chart, below shows how the increase in multifamily mortgage holdings relates to the level of current holdings for the different type of firms holding the debt. Positive numbers indicates that the firms are increasing their relative holdings of mortgage debt while negative numbers indicate that firms are decreasing their relative holdings.

The chart shows that banks and thrifts, life insurance companies and REITs increased their share of holdings during the quarter while the other entities listed decreased their share. While the increase in holding by REITs is the largest in relative terms, the increase on the part of banks and thrifts is more significant given that they are the second largest holders of multifamily mortgage debt.
The report does not cover loans for acquisition, development or construction, or loans collateralized by owner-occupied commercial properties. The full report also includes information on mortgage debt outstanding for other commercial property types. The full report can be found here.


