

The latest rent report from Apartment List shows strongly positive rent growth for the country as-a-whole. Rents were up month-over-month and year-over-year in all of the 50 largest metro areas.
Rent increases continue
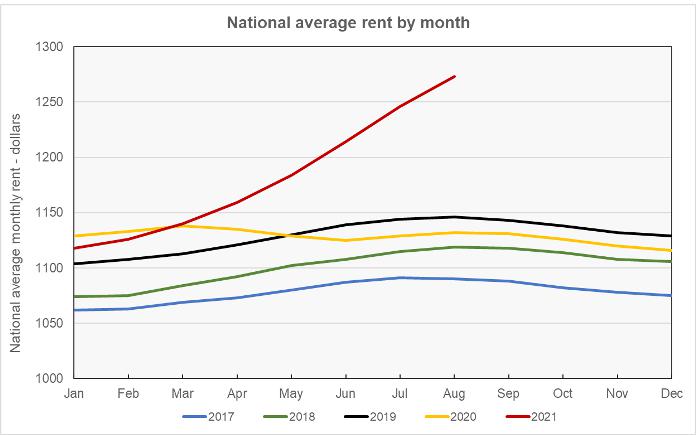
Apartment List reported that the national average rent growth reached 2.2 percent for the month of August, down from the 2.6 percent rate of rent growth reported last month. The national average rent growth was 12.5 percent year-over-year, once again a record for the Apartment List data set which goes back to 2017.
The first chart, below, shows the annual pattern of rent growth for the years for which Apartment List has data. While the data set only includes 4 prior years, the chart makes the unusual size of this year’s rent increases very apparent.
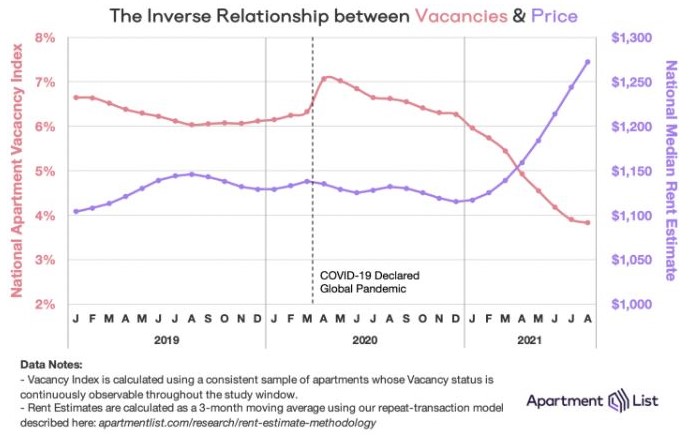
Apartment List cites the falling vacancy rate as a key factor in the recent surge in rents. This, in turn, is being driven by the pandemic-related changes in the number of US households. Early in the pandemic, the number of households fell as people consolidated their housing in response to the shutdown of the economy. Recently, the number of US households has risen to a record level in response to the economy reopening. The recent trends in vacancy rate and median rents are shown in the following chart reproduced from the Apartment List report.
Core versus metro
Apartment List provides the underlying data they collected in compiling their report and that data was used to create the tables, below. The tables look at the 50 largest metropolitan statistical areas by population as defined by the US Census Bureau and identify the top 10 metros for year-over-year rent increases and the bottom 10 metros for year-over-year rent decreases. They provide the average monthly rent in the metro, the annual percentage change in rent (YoY Metro) along with the percentage change from the prior month’s rent level (MoM Metro). They also list the year-over-year percentage change in rent for the core city in each metro area (YoY Core).
The first table shows the 10 metros with the largest annual rent decreases. In each case, the rent growth in the core city of the metro area is lower than that of the metro area as-a-whole. While the table lists two core cities with negative rent growth for the year, all of the broader metro areas experienced positive rent growth both month-over-month and year-over-year.
| Metro | Metro Rent | YoY Metro | MoM Metro | YoY Core |
| San Francisco | $2,257 | 1.6 | 1.6 | 0.3 |
| San Jose | $2,423 | 2.7 | 2.4 | -4.7 |
| Minneapolis | $1,301 | 2.8 | 0.4 | -1.8 |
| Louisville | $977 | 5.7 | 1.0 | 0.9 |
| Milwaukee | $1,061 | 6.4 | 0.7 | 0.3 |
| Washington DC | $1,854 | 7.1 | 2.0 | 2.6 |
| Chicago | $1,355 | 7.5 | 1.0 | 1.3 |
| Pittsburgh | $1,006 | 7.6 | 0.7 | 0.7 |
| Kansas City | $1,168 | 8.0 | 0.7 | 0.6 |
| Cincinnati | $994 | 8.1 | 1.3 | 1.5 |
The metros in the top 50 by population with the largest year-over-year rent increases are listed in the next table, below. Fast growing sunbelt cities are well represented in this table. A notable thing about the data for these metros is that their rates of rent growth are much higher than those in the table above despite their median rent levels also being higher in many cases. Also notable is that the difference between rates of rent growth in the core cities of the metros are generally much smaller than those of the metros listed in the first table.
| Metro | Metro Rent | YoY Metro | MoM Metro | YoY Core |
| Tampa | $1,626 | 28.3 | 4.2 | 29.4 |
| Phoenix | $1,622 | 24.8 | 3.4 | 22.9 |
| Jacksonville | $1,481 | 23.7 | 4.1 | 23.4 |
| Miami | $1,820 | 22.3 | 3.4 | 20.0 |
| Las Vegas | $1,539 | 21.8 | 3.3 | 21.0 |
| Inland Empire* | $1,946 | 21.0 | 1.9 | 16.9 |
| Atlanta | $1,493 | 20.4 | 3.3 | 15.8 |
| Orlando | $1,611 | 20.0 | 4.0 | 21.2 |
| Austin | $1,632 | 19.3 | 3.6 | 19.2 |
| Memphis | $1,218 | 19.3 | 2.6 | 17.0 |
*Riverside-San Bernardino-Ontario
The complete Apartment List report covers many more metros and contains some interesting charts illustrating how rents have changed over time in the hardest hit markets. It also provides readers with the opportunity to download their data sets. It can be found here.


