

The latest rent reports from Yardi Matrix and Apartment List show strongly positive rent growth for the country as-a-whole in September.
Rents up across the board
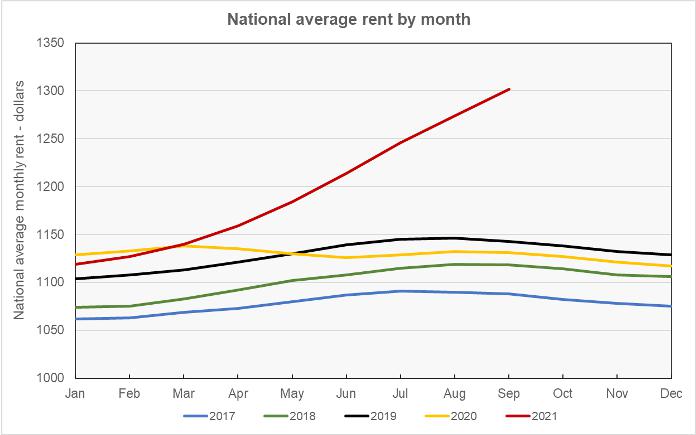
Yardi Matrix reported that the national average apartment rent rose $16 in September to $1,558. This was up 11.4 percent from its year-earlier level. Apartment List reported that the national average rent rose $28 for the month and was up 12.5 percent from its year-earlier level at $1,302.
While the figures for year-over-year rent growth may be boosted by the relatively weak performance for rents last year, the growth in rents since March has been extraordinary. This is illustrated in the first chart, below, which plots the national average rent data from Apartment List for the last 5 years.
Although rents are often softening during this time of the year, that has not been the case this year. Both Yardi Matrix and Apartment List point to declining vacancy rates as driving rent growth. However, they also state that the recent decline in vacancies may have run its course, with occupancy remaining constant, or even falling in some markets. This may temper the rate of rent growth in the coming months.
Rent growth hits new highs
The metros with the largest annual rent increases as ranked by Yardi Matrix are given in the table, below, along with the annual rent changes given for the metros in the two reports.
While both reports show similar trends, the size of the rent increases reported vary both because of differences in how the two reports define the boundaries of the metro areas and also because the property sets covered by the reports are different. Yardi Matrix focuses on professionally managed rental property while Apartment List seeks to also include rental property managed by smaller operators.
| Metro | Yardi Matrix | Apartment List |
| Phoenix | 22.8 | 28.5 |
| Tampa | 22.6 | 32.9 |
| Las Vegas | 20.6 | 26.2 |
| Miami Metro | 20.6 | 27.0 |
| Raleigh | 19.3 | 21.8 |
| Inland Empire | 18.4 | 22.0 |
| Atlanta | 17.0 | 23.7 |
| Austin | 16.4 | 23.7 |
| Charlotte | 15.8 | 19.7 |
| Nashville | 14.7 | 18.3 |
The major metros with the smallest year-over-year rent increases as determined by Yardi Matrix are listed in the next table, below, along with the year-over-year rent increases given for the metros in the two reports.
| Metro | Yardi Matrix | Apartment List |
| Twin Cities | 3.1 | 4.2 |
| San Francisco | 3.7 | 5.9 |
| San Jose | 5.6 | 8.8 |
| Kansas City | 5.7 | 8.4 |
| New York | 6.0 | 11.3 |
| Los Angeles | 7.2 | 12.5 |
| Washington DC | 7.8 | 9.9 |
| Chicago | 8.4 | 9.3 |
| Houston | 8.4 | 10.5 |
| Indianapolis | 8.5 | 12.5 |
Rent divergence
The Yardi Matrix report looks at two classes of rental properties: lifestyle (renter by choice) properties and renter by necessity (workforce) properties. In recent years, rents have grown more rapidly for the latter category of properties. That trend has reversed since the easing of the pandemic, with rents increasing at a higher rate in the lifestyle asset class despite that asset class generally having higher rents. That pattern continued in September with the annual rent growth rate of lifestyle properties outpacing that of renter by necessity properties by 13.4 percent to 9.5 percent.
Yardi Matrix also tracks rent growth trends for single-family rentals (SFR). In September, the year-over-year rent growth for SFR properties was 14.3 percent, well above the 11.3 percent recorded for multifamily properties.
The complete Yardi Matrix report discusses some of the smaller multifamily housing markets. It has more information about the larger markets including numbers on job growth and completions of new units. It also includes charts showing the history of rent changes in 18 of the top 30 markets over the last 4 years. It can be found here.
The complete Apartment List report covers many more metros and provides readers with the opportunity to download their data sets. It can be found here.


