

The Census Bureau’s new residential construction report for November showed higher multifamily housing construction activity than in recent months in all three measures that we track.
Multifamily housing permits edge higher
The number of permits issued for buildings with 5 or more units in November was reported to be 560,000 units on a seasonally adjusted, annualized basis. This was up 6.1 percent (32,000 units) from the October’s figure. November permits were up 15 percent from the level recorded in November 2020 and were up 9 percent compared to the trailing 12-month average.
In addition, 49,000 permits were issued in November for units in buildings with 2 to 4 units. This was down 4 percent (2,000 units) from the revised level for October. November permits for units in buildings with 2 to 4 units were down 9 percent from the year-ago level and down 4 percent compared to the trailing 12-month average.
Regional data for multifamily housing is only reported for structures with two or more units. “Structures with 5 or more units” is not broken out as a separate category. Since the regional data is highly volatile and is frequently revised, it is examined here based on three-month moving averages. This averaging will tend to smooth out the month-to-month variations in the data.
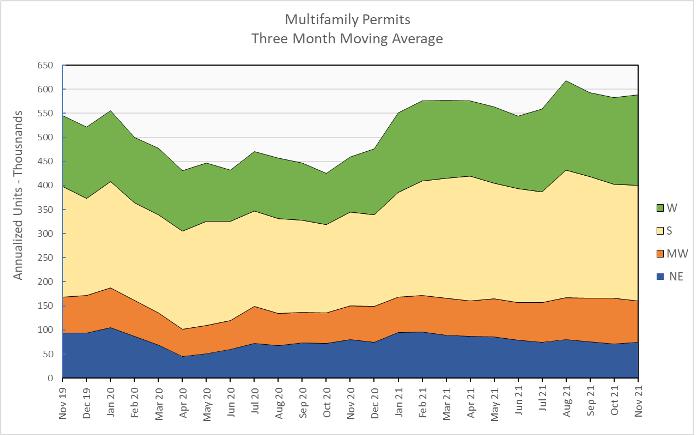
Nationally, the three-month weighted moving average for permits issued for multifamily housing in November was up 1 percent from the level in October but was 28 percent higher than the level of November 2020. Permit issuance history is shown in the first chart, below. The three-month weighted moving average for permits came it at 588,000 units.
On a month over month basis, the three-month weighted moving average for permit issuance was up 7 percent in the Northeast, 4 percent in the West and 2 percent in the South but was down 10 percent in the Midwest.
When compared to year-earlier levels, the three-month weighted moving average of permits issued was up 64 percent in the West, 23 percent in the South and 22 percent in the Midwest, but was down 7 percent in the Northeast.
The following chart shows the three-month weighted moving averages of permits by region for the last 25 months.
Multifamily housing construction starts rise
The preliminary November figure for multifamily housing starts in buildings with 5 or more units was 491,000 units on a seasonally adjusted, annualized basis. This was reported to be up 12 percent (53,000 units) from the revised figure for October, but most of this apparent increase was due to October’s preliminary starts figure being revised downward by 32,000 units. Still, the reported starts figure was the highest since February 2020, before the pandemic.
Compared to November 2020, multifamily housing starts in buildings with 5 or more units was up 40 percent. The preliminary starts figure reported for November 2021 was 13 percent above the trailing 12-month average and 26 percent above the monthly average for 2019.
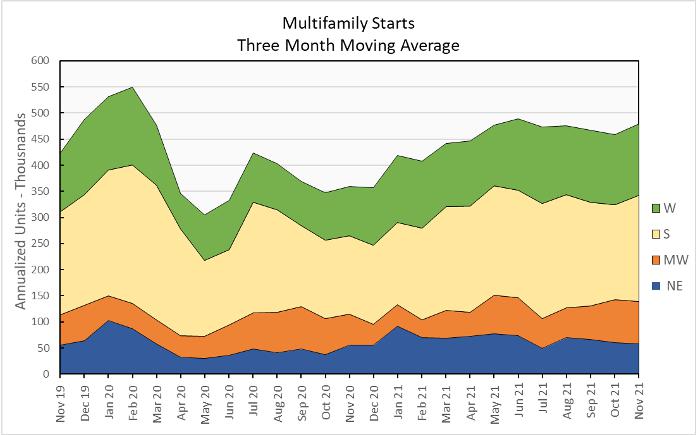
Multifamily housing construction starts (two or more units per building) in November were up 5 percent from their October level for the country as-a-whole, based on three-month weighted moving averages. Starts were up 12 percent in the South and 2 percent in the West but down 1 percent in the Midwest and 4 percent in the Northeast from the levels of the prior month.
The three-month weighted moving average of starts was up 33 percent for the country-as-a-whole on a year-over-year basis. Compared to November 2020, starts were up 45 percent in the West, 36 percent in the South, 35 percent in the Midwest and 5 percent in the Northeast.
The following chart shows the starts by region for the last 25 months.
Multifamily housing completions also higher
The preliminary November multifamily housing unit completions figure in buildings with 5 or more units per building was 364,000 units on a seasonally adjusted, annualized basis. This was reported to be up 20 percent (60,000 units) from October’s revised (+2,000) figure.
Compared to November 2020, multifamily housing completions in buildings with 5 or more units per building were up 14 percent. Compared to the trailing 12-month average, completions were up less than 1 percent and compared to the monthly average for 2019, completions were up 5 percent.
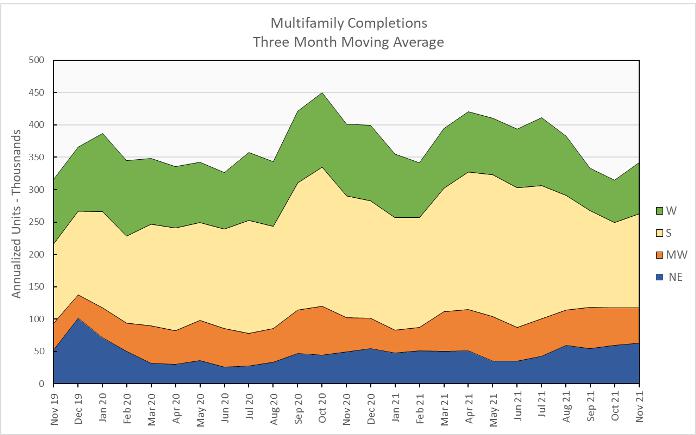
For the country as-a-whole, multifamily housing construction completions (two or more units per building) were up 8 percent month-over-month, comparing three-month weighted moving averages. The three-month weighted moving averages of completions was up 20 percent in the West, 10 percent in the South, 5 percent in the Northeast, but fell 5 percent in the Midwest.
On a year-over-year basis, the three-month weighted moving average of completions in buildings with 2 or more units per building was down 15 percent nationally. Completions were up 26 in the Northeast and 4 percent in the Midwest but fell 23 percent in the South and 29 percent in the West.
Completions by region for the past 25 months are shown in the chart below.
All data quoted are based on seasonally adjusted results and are subject to revision.


