

The latest rent report from Apartment List shows only marginal rent growth month-over-month in November. Nationally, rents rose 0.1 percent for the month, although they were up 17.7 percent year-over-year.
Rent increases
The first chart, below, shows the history of rent growth year-by-year for the years for which Apartment List has data. The usual pattern is for rents to rise in the spring and summer months and fall slightly in the autumn and winter months, with the average rent edging up each year. The pandemic disrupted this pattern with rents falling in the summer of 2020 and declining for the year. However, rents rebounded strongly in 2021, rising at the fastest pace seen in Apartment List’s data set.
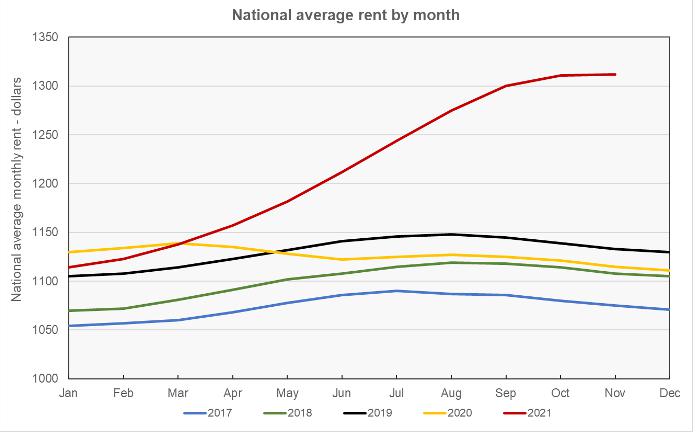
Apartment List cites changes in vacancy rates as key factors driving changes in rents. The vacancy rate rose to 7.1 percent in April 2020 as pandemic-related lockdowns were imposed, leading to declining rents. However, the vacancy rate then began a downward trend, bottoming out at 3.8 percent in August 2021. This latter period coincided with a period of rising rents, with the rate of rent increases peaking at about the time that vacancies were at their lowest.
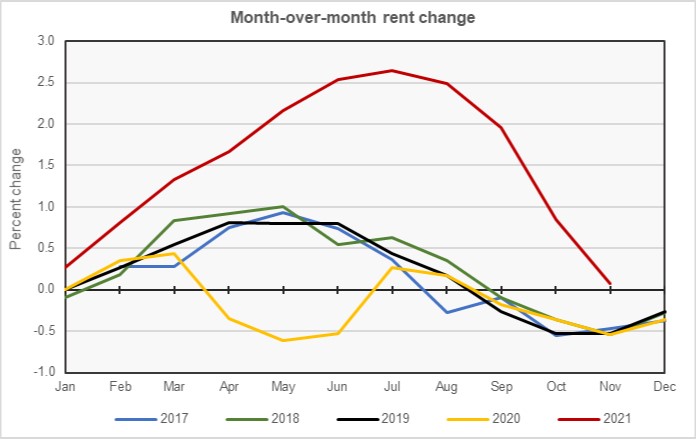
Since August, vacancies have been trending upward, reaching 4.2 percent in November. The rate of monthly rent increases declined over this time, as shown in the next chart, below. It shows that rents were nearly unchanged, month-over-month in November. This compares to a “normal” rent decline of 0.5 percent for the month of November based on the rent growth history between 2017 and 2019.
Leaders and trailers
Apartment List makes available the underlying data they collected in compiling their report and that data was used to create the tables, below. The tables look at the 50 largest metropolitan statistical areas by population as defined by the US Census Bureau and identify the top 10 metros for year-over-year rent increases and the bottom 10 metros for year-over-year rent decreases. They provide the average monthly rent in the metro, the annual percentage change in rent (YoY Metro) along with the percentage change from the prior month’s rent level (MoM Metro). They also list the percentage change in rent for the metro area compared to the rent level in March 2020, right before the pandemic struck (Mar 20).
The first table shows the 10 metros with the smallest annual rent increases. All of these metros and all of their core cities achieved positive rent growth year-over-year, something that was not true a year ago. However, half of the metros saw rents decline month-over-month. Overall, 26 of the 50 largest metros saw month-over-month rent declines in November.
Of the metros listed in the first table, only San Francisco has rents that are still below their pre-pandemic levels, although Minneapolis very nearly did also. Of the other of the 50 largest metros, only San Jose, Calif. also has rents that are still below their pre-pandemic levels. Rents there are down by 6.8 percent.
| Metro | Metro Rent | YoY Metro | MoM Metro | Mar 20 |
| Minneapolis | $1,291 | 5.7 | -0.4 | 0.3 |
| Louisville | $1,001 | 8.1 | 0.3 | 8.8 |
| Kansas City | $1,172 | 9.5 | -0.3 | 9.6 |
| San Francisco | $2,231 | 9.6 | -1.5 | -6.4 |
| St Louis | $1,105 | 9.7 | 0.0 | 10.6 |
| Milwaukee | $1,081 | 10.1 | -0.6 | 10.8 |
| Birmingham | $1,146 | 10.1 | -1.0 | 13.1 |
| Cleveland | $994 | 10.3 | 0.1 | 13.6 |
| Detroit | $1,162 | 10.5 | 0.0 | 15.4 |
| Houston | $1,252 | 10.9 | 0.2 | 8.3 |
The metros in the top 50 by population with the largest year-over-year rent increases are listed in the next table, below. Not only are rents up significantly over the last 12 months, they are also up significantly since March 2020. However, despite the high annual rate of rent growth for these metros, 3 of them experienced rent declines for the month in November.
| Metro | Metro Rent | YoY Metro | MoM Metro | Mar 20 |
| Tampa | $1,724 | 33.8 | -0.5 | 36.4 |
| Miami | $1,963 | 30.7 | 1.7 | 27.7 |
| Phoenix | $1,721 | 29.6 | 0.2 | 32.6 |
| Las Vegas | $1,666 | 28.4 | 0.1 | 34.3 |
| Jacksonville | $1,541 | 28.2 | 0.3 | 31.3 |
| Orlando | $1,687 | 27.5 | 0.7 | 22.4 |
| Austin | $1,681 | 25.2 | -0.2 | 19.9 |
| Atlanta | $1,571 | 24.5 | 0.5 | 26.7 |
| Raleigh | $1,490 | 21.8 | -0.7 | 22.1 |
| Nashville | $1,490 | 21.0 | 0.5 | 18.1 |
The complete Apartment List report covers many more metros and contains some interesting charts illustrating how rents have changed over time in major markets. It also provides readers with the opportunity to download their data sets. It can be found here.


