

New reports from CoStar and from Real Capital Analytics (RCA) state that commercial real estate prices reached an all-time high in November, with multifamily property prices showing strong year-over-year gains.
Indexes defined
The CoStar report focuses on a property price index called the CoStar Commercial Repeat Sales Index (CCRSI) while the RCA report focuses on an index called the Commercial Property Price Index (CPPI). Both indexes are computed based on the resale prices of properties whose earlier sales prices and sales dates are known. The indexes represent the relative change in the price of property over time rather than its absolute price.
In November, CoStar identified 1,797 repeat sale pairs for all property types. These sales pairs were used to calculate the results quoted here.
Price performance is mixed
CoStar reported that its value-weighted index of multifamily property prices increased 19.5 percent year-over-year in November 2021. The index was up 1.4 percent month-over-month.
RCA reported that its national index of multifamily property prices increased 19.2 percent, year-over-year, in November. The index was up 1.8 percent month-over-month.
CoStar reported that the value-weighted CCRSI of commercial property rose by 13.9 percent, year-over-year, in November. The index rose 0.9 percent month-over-month. The other commercial property types tracked by CoStar are office, retail, industrial and hospitality.
RCA reported that the CPPI national all-property index rose 18.4 percent year-over-year in November, a series record. The index rose 2.3 percent month-over-month. The other commercial property types tracked by RCA are office, retail and industrial.
Comparing indexes
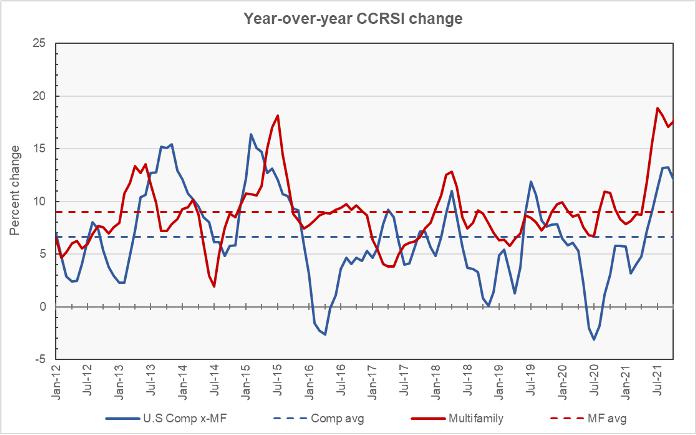
The first chart, below, shows the history of the year-over-year change in the value-weighted CCRSI’s for multifamily property and for all other commercial property considered as a single asset class since January 2012. The chart also shows the averages of the two indexes over that time span. The average price appreciation for multifamily property over this period is 9.0 percent while the long-term average price appreciation for all other commercial property is 6.6 percent.
The second chart, below, shows the history of the year-over-year change in the national CPPI’s for multifamily property and for all other commercial property considered as a single asset class since January 2012. The chart also shows the averages of the two indexes over the time span shown. The average price appreciation for multifamily property over this period is 10.4 percent while the long-term average price appreciation for all other commercial property is 7.9 percent.
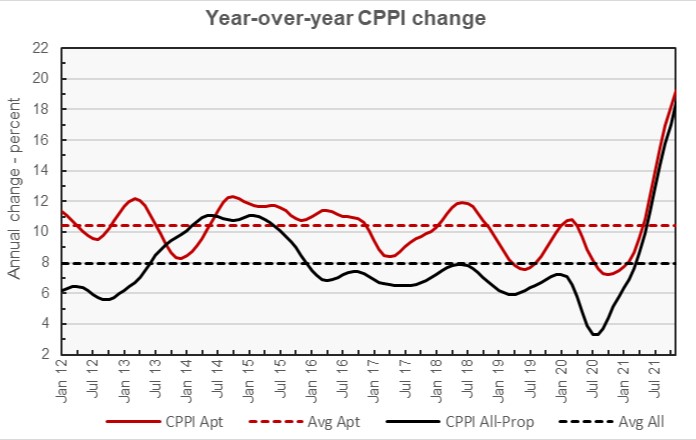
Differences in the long-term results between the CCRSI and CPPI results may be partly explained by the fact that the CCRSI graphed above is value-weighted while the CPPI is equal weighted. In addition, the CCRSI includes data for hospitality properties, which has been under particular stress, while the CPPI does not.
Transaction volumes continue to moderate
CoStar reported that number of repeat-sale transactions were down 16 percent in November from October’s volume. On a dollars basis, repeat-sale transactions were down 22 percent to $15.1 billion. However, both of these figures are significantly higher than those recorded in February 2020, before the pandemic.
CoStar also reported that distressed sales accounted for only 1.2 percent of transactions, the lowest level they have seen since they began tracking this data in 2008.
The full reports discuss other commercial property types. While the CoStar report provides information on transaction volumes, it does not break out multifamily transactions. The latest CoStar report can be found here. Access to the RCA report can be obtained here.


