

The latest rent report from Apartment List shows that the national average rent growth in March was 0.8 percent month-over-month and 17.1 percent year-over-year. The monthly rate is up slightly but the annual rate is down slightly from those reported last month.
The history of rent growth
In the three “normal” years, i.e. those before 2020, for which Apartment List has data on the month-over-month rent increase for March, rents were up between 0.3 and 0.9 percent in the month. In March 2020, when the pandemic was just emerging, rents were up a fairly typical 0.4 percent. By contrast, in 2021, rents jumped 1.3 percent in March. For 2022, the month-over-month rent growth in March of 0.8 percent is lower than that in 2020 and also lower than that seen in 2018. However, the year-to-date rent increase of 1.8 percent in 2022 greatly outpaces the 0.8 percent seen through the first three months of 2018, while it trails the 2.4 percent growth seen through the first three months of 2021.
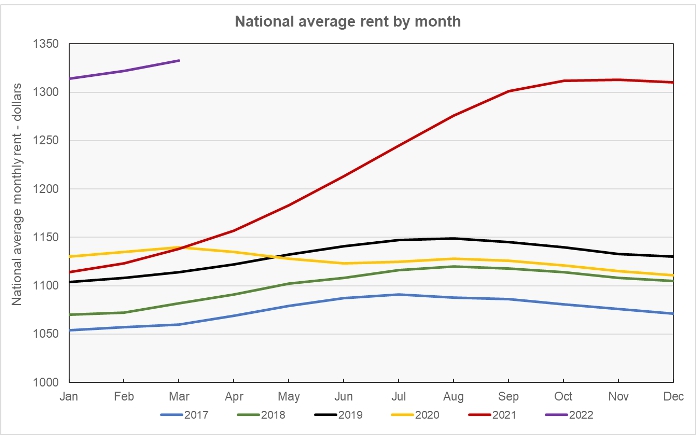
The first chart, below, shows the history the national average rent from the Apartment List data set. The data is plotted over a 12 month span so that the seasonal pattern of rent growth is visible.
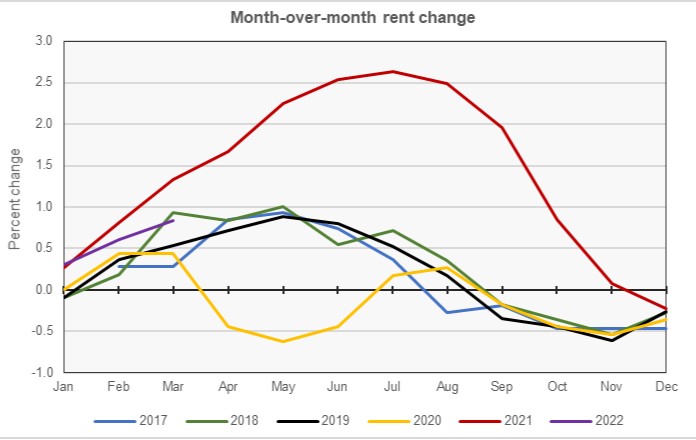
The next chart presents the same data viewed as the month-over-month change in the national average rent since 2017. While 2022 started off with the highest rate of month-over-month rent growth for any January in the data set, the relative pace of rent growth has been decreasing. February had the second-highest rate of rent growth and March had the third highest rate of rent growth in the data set. Rent growth in 2022 may turn out to be closer to that of a “normal” year than to that of the extraordinary 2021.
Apartment List reported that vacancies continued their upward trajectory in March, rising to 4.6 percent. This is up from the low of 3.8 percent experienced last summer. While the vacancy rate is still well below the rate of 6 percent seen before the pandemic, the fact that it is steadily rising is likely to cause the rate of rent growth in the months ahead to be below the pace set last year when the vacancy rate was falling.
Leaders and trailers
Apartment List provides the underlying data they collected in compiling their report and that data was used to create the tables, below. The tables look at the 50 largest metropolitan statistical areas by population as defined by the US Census Bureau and identify the top and bottom 10 metros for year-over-year rent growth. The tables provide the average monthly rent in the metro, the annual percentage change in rent (YoY Metro) along with the percentage change from the prior month’s rent level (MoM Metro). They also list the percentage change in rent for the metro area compared to the rent level in February 2020, right before the pandemic struck (Feb 20).
The first table shows the 10 metros with the largest annual rent percentage increases. Only one of these metros saw its rent fall month-over-month in March. Only one other of the 50 largest metros saw rents decline month-over-month in March.
| Metro | Metro Rent | YoY Metro | MoM Metro | Feb 20 |
| Miami | $2,046 | 30.4 | 1.0 | 33.0 |
| Tampa | $1,739 | 29.4 | 0.9 | 37.8 |
| Orlando | $1,741 | 27.9 | 1.3 | 26.9 |
| Phoenix | $1,737 | 25.6 | 0.5 | 34.2 |
| Las Vegas | $1,650 | 24.1 | 0.3 | 33.0 |
| Jacksonville | $1,517 | 23.1 | -0.3 | 30.0 |
| Austin | $1,710 | 22.8 | 1.0 | 22.1 |
| Nashville | $1,516 | 21.7 | 1.1 | 21.3 |
| Raleigh | $1,518 | 21.4 | 1.1 | 25.4 |
| Salt Lake City | $1,571 | 21.2 | 0.9 | 26.1 |
The next table shows the 10 metros with the smallest annual rates of rent growth. None of these metros saw its rent fall month-over-month in March.
Of the 50 largest metros, only San Francisco (-3.5 percent) and San Jose (-1.9 percent) have average rent levels that are still below those from February 2020.
| Metro | Metro Rent | YoY Metro | MoM Metro | Feb 20 |
| Minneapolis | $1,311 | 7.1 | 1.1 | 2.8 |
| Detroit | $1,164 | 9.3 | 0.5 | 15.9 |
| Pittsburg | $1,008 | 9.3 | 0.4 | 8.9 |
| Kansas City | $1,189 | 9.6 | 0.6 | 12.2 |
| St Louis | $1,120 | 10.1 | 0.5 | 12.9 |
| Cleveland | $1,011 | 10.3 | 0.6 | 15.0 |
| Milwaukee | $1,102 | 10.6 | 0.9 | 13.5 |
| Hartford | $1,525 | 11.2 | 1.5 | 17.1 |
| Louisville | $1,022 | 11.5 | 1.0 | 11.9 |
| Columbus | $1,118 | 11.5 | 0.5 | 15.7 |
The complete Apartment List report covers many more metros and contains some interesting charts illustrating how rents have changed over time. It also provides readers with the opportunity to download their data sets. It can be found here.


