

A new report from Real Capital Analytics (RCA) said that multifamily property prices rose 23.0 percent year-over-year in April and that they rose 1.3 percent from the month before. The annual rate of increase is up from that initially posted last month. However, updates to last month’s data leave the annual rate of increase effectively unchanged for the month at a near all-time high.
Defining CPPI
Real Capital Analytics tracks an index they call the Commercial Property Price Index (CPPI). The index is computed based on the resale prices of properties whose earlier sales prices and sales dates are known. The index represents the relative change in the price of property over time rather than its absolute price. Note that, as properties are added to the RCA dataset each month, they recalculate the CPPI all the way back to the beginning of the data series.
Price growth seen across property classes
Price appreciation in April for all commercial property as a single asset class was 17.9 percent year-over-year, down slightly from the levels in recent months. Prices for all commercial property as a single asset class rose by 0.5 percent from the level of the previous month. In addition, updates to the data turned last month’s reported decline in this index into a gain.
Price appreciation for industrial properties was 1.3 percent for the month and 26.0 percent over the past 12 months, once again the highest rates of any commercial property type covered.
Two commercial property classes that have been poor performers recently showed signs of recovery. The CPPI for offices within central business districts was up 1.0 percent for the month and 12.3 percent for the year while the CPPI for retail properties was up 0.6 percent for the month and 18.4 percent for the year.
The poorest performing commercial property class this month was suburban offices. The price index for these properties rose 0.3 percent for the month and 10.3 percent for the year.
Tracking price appreciation
The first chart, below, plots the year-over-year changes in the values of the CPPI since January 2012 for all commercial property as a single asset class and for apartments. The chart shows that the recent high rate of price increases for commercial property as-a-whole has started to subside, while the rate of growth in multifamily property prices has seemingly reached a plateau.
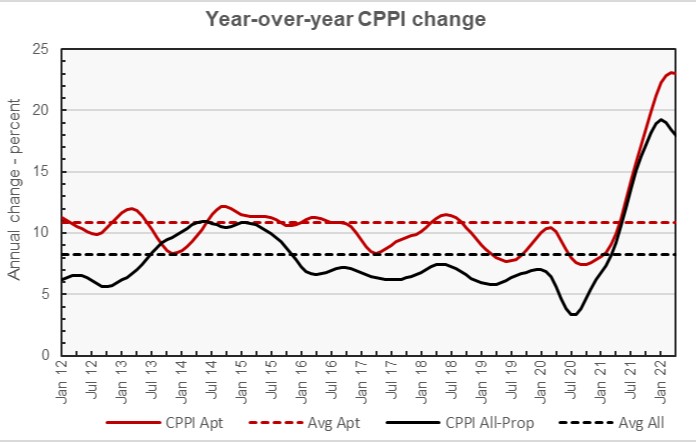
The chart also shows the average rates of annual appreciation in the indexes for the two property classes. The average annual appreciation in multifamily property prices since January 2012 is 10.9 percent, while the average annual appreciation rate for all commercial property as a single asset class is 8.3 percent.
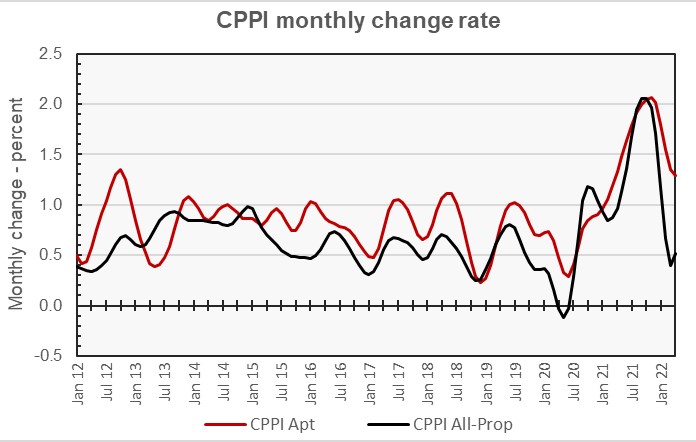
The next chart, below, plots the month-over-month change in the value of the CPPI since January 2012 for all commercial property as a single asset class and for apartments. The chart shows that the monthly rate of increases in multifamily property prices continued its decline this month. However, the CPPI for all commercial property moved up slightly this month and is now only slightly below its average level between January 2012 and February 2020.
Signs of life for major metros
The RCA report provides data comparing the price changes of commercial property in 6 major metro areas* against those in the rest of the country, although it does not separate out apartments from other commercial property types in this comparison. The next chart, below, plots the history of the month-over-month change in the price indexes for the two types of property markets since January 2012.
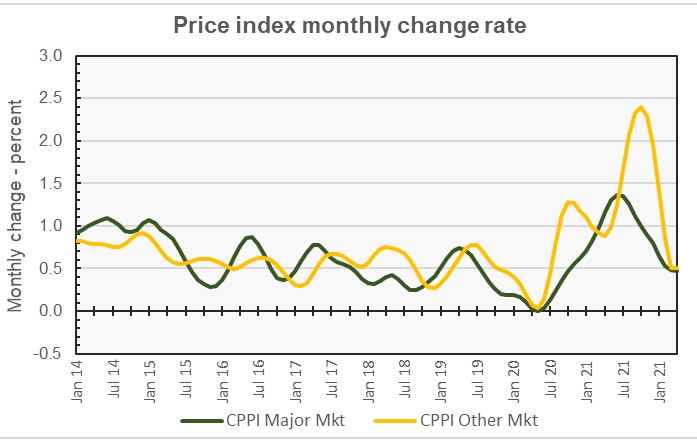
The chart shows that the average monthly price appreciation of commercial property in non-major metros has generally outpaced that in major metros since the middle of 2019. However, the recent decline in the rate of price appreciation in non-major metros has left the month-over-month gains in the CPPI for the two regions nearly the same.
By the numbers, price appreciation for commercial property in major markets was reported to be 0.5 percent for the month and 11.8 percent for the year. Price appreciation for commercial property in non-major markets was also reported to be up 0.5 percent. In addition, updates to the data changed the month-over-month price decline reported for properties in non-major metros in March into a price gain. Price appreciation in non-major markets for the year was 19.8 percent.
Taken together, the recent strength in the CPPI for offices in central business districts and in the CPPI for major metros may be an indicator that commercial real estate investors are returning to the city centers, which fell out of favor due to fallout from the pandemic.
The full report provides more detail on other commercial property types. Access to the RCA report can be obtained here.
*The major metros are Boston, Chicago, Los Angeles, New York, San Francisco and Washington DC.


