

The Census Bureau’s report on construction spending shows that the value of residential construction put in place in March was up 1.0 percent from the revised level of the month before. Residential construction spending was up 18.2 percent year-over-year.
Single-family construction spending up again
The reported value of total private residential construction put in place in March 2022 was $882.0 billion on a seasonally adjusted, annualized basis. This figure, which includes spending on both new construction and on improvements, was reported to be up $8.8 billion from February’s revised figure. Given that the preliminary figure reported for February was revised upward by $22.6 billion, the preliminary figure for March is up by $31.4 billion from the preliminary figure for February reported last month.
The value of new private construction of multifamily residential buildings put in place in March was reported to be $101.1 billion on a seasonally adjusted, annualized basis. This was reported to be down $0.5 billion from the revised (+$91 million) level for February. The value of multifamily housing construction put in place in March 2022 was 3.9 percent higher than the level of March 2021.
State and local governments were reported to have put $7.1 billion in multifamily residential construction in place in March on a seasonally adjusted annualized basis.
The value of new single-family residential construction put in place in March was $472.8 billion on a seasonally adjusted, annualized basis. This was up 1.3 percent from the revised (+$1.4 billion) level for February and was up 19.4 percent from the level of March 2021.
The value of improvements to residential buildings put in place in March was reported to be $308.2 billion on a seasonally adjusted, annualized basis. This was up 22.5 percent from the year-earlier level and was up 1.1 percent from the revised (+$21.1 billion) level for February. The Census Bureau does not separate out improvements for single-family and multifamily residential buildings.
Charting the data
The first chart, below, shows the history of new private residential construction spending since January 2000 for single-family housing, multifamily housing and residential improvements.
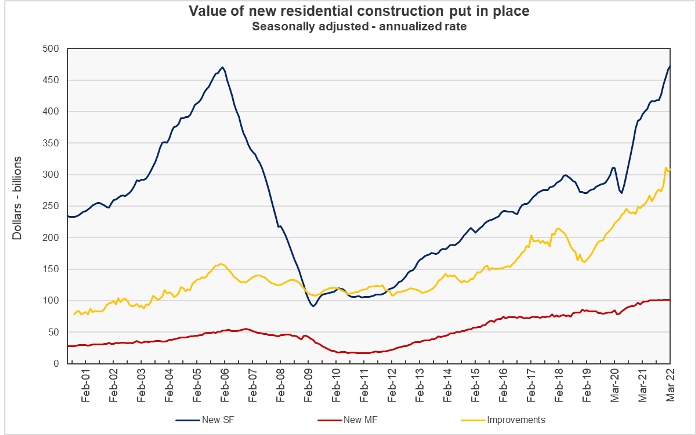
The chart shows that the value of single-family housing put in place in March is now fractionally above the peak level it reached in February 2006 during the housing bubble. The value of multifamily housing put in place in March is 84 percent higher than the prior peak reached in December 2006.
The next chart shows the value of residential construction put in place each month relative to its level in January 2016. This chart allows the recent rates of change in the values of the three categories of residential construction spending to be compared. It also allows the recent plateau in the value of multifamily residential construction put in place to be more clearly observed.
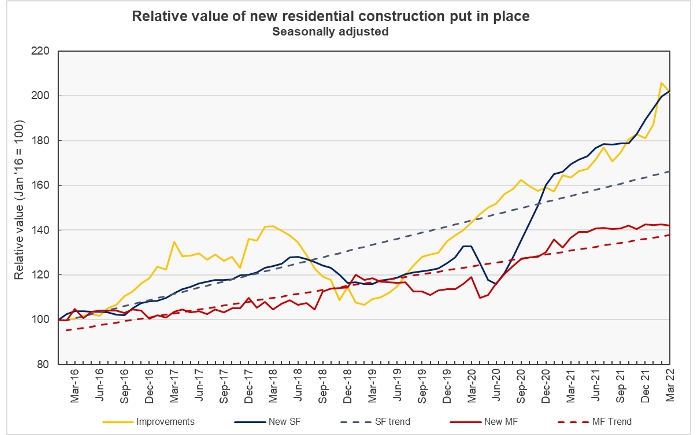
In contrast to this report that the dollar value of multifamily residential construction put in place has been steady for nearly a year, the Census Bureau’s report on new residential construction shows that the number of unit completions has been falling lately and is now significantly lower than the average level from last summer. The Census Bureau makes no attempt to reconcile these findings.
The report from the Census Bureau also includes information on spending on other types of construction projects. The full report can be found here.


