

The Census Bureau’s new residential construction report for May showed softening in multifamily permit issuance and a drop in unit starts. Unit completions rose during the month but still trailed unit starts resulting in another increase in the number of units under construction.
Multifamily housing permits issuance falls
The number of permits issued for buildings with 5 or more units in May was reported to be 592,000 units on a seasonally adjusted, annualized basis. This was down 10 percent (66,000 units) from April’s revised (+2,000 units) figure. May permits were up 20 percent from the level recorded in May 2021 and were effectively equal to the trailing 12-month average.
In addition, 55,000 permits were issued in May for units in buildings with 2 to 4 units. This was down 1,000 units from the revised (+3,000 units) level for April. May permits for units in buildings with 2 to 4 units were up 7 percent from the year-ago level and were 2 percent higher than the trailing 12-month average.
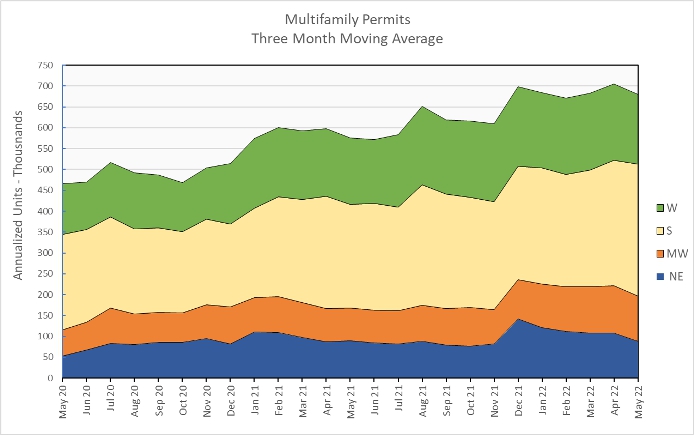
Regional data for multifamily housing is only reported for structures with two or more units. “Structures with 5 or more units” is not broken out as a separate category. Since the regional data is highly volatile and is frequently revised, it is examined here based on three-month moving averages. This averaging will tend to smooth out the month-to-month variations in the data.
Nationally, the three-month weighted moving average for permits issued for multifamily housing in May was down 3 percent from the level in April but was 18 percent higher than the level of May 2021. Permit issuance history is shown in the first chart, below. The three-month weighted moving average for permits came it at 681,000 units.
On a month over month basis, the three-month weighted moving average for multifamily permit issuance was up 5 percent in the South. Multifamily permits issuance was down 5 percent in the Midwest, 8 percent in the West and 18 percent in the Northeast.
When compared to year-earlier levels, the three-month weighted moving average of permits issued was up 40 percent in the Midwest, 27 percent in the South and 6 percent in the West. Permit issuance fell 2 percent in the Northeast
The following chart shows the three-month weighted moving averages of permits by region for the last 25 months.
Multifamily housing construction starts fall from recent high
The preliminary May figure for multifamily housing starts in buildings with 5 or more units was 469,000 units on a seasonally adjusted, annualized basis. This was reported to be down 27 percent (172,000 units) from the revised figure (+29,000 units) for April.
Compared to the level of May 2021, multifamily housing starts in buildings with 5 or more units were down 3 percent. The reported starts figure was 7 percent below the trailing 12-month average but 21 percent higher than the monthly average from 2019.
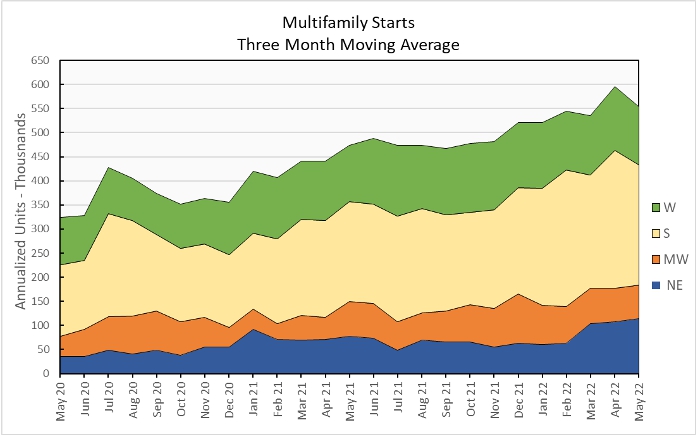
Multifamily housing construction starts (two or more units per building) in May were down 7 percent from their April level for the country as-a-whole, based on three-month weighted moving averages. Starts were up 6 percent in the Northeast and 1 percent in the Midwest. Starts fell 9 percent in the West and 13 percent in the South from the levels of the prior month.
The three-month weighted moving average of starts was up 17 percent for the country-as-a-whole on a year-over-year basis. Compared to May 2021, starts were up 48 percent in the Northeast, 20 percent in the South and 4 percent in the West. Starts fell 31 percent in the Midwest.
The following chart shows the three-month weighted moving average of starts by region for the last 25 months.
Multifamily housing completions jump
The preliminary May multifamily housing unit completions figure in buildings with 5 or more units per building was 417,000 units on a seasonally adjusted, annualized basis. This was reported to be up 33 percent (104,000 units) from April’s revised (+32,000 units) figure.
Compared to May 2021, multifamily housing completions in buildings with 5 or more units per building were up 12 percent. Compared to the trailing 12-month average, completions were up 23 percent and compared to the monthly average for 2019, completions were up 20 percent.
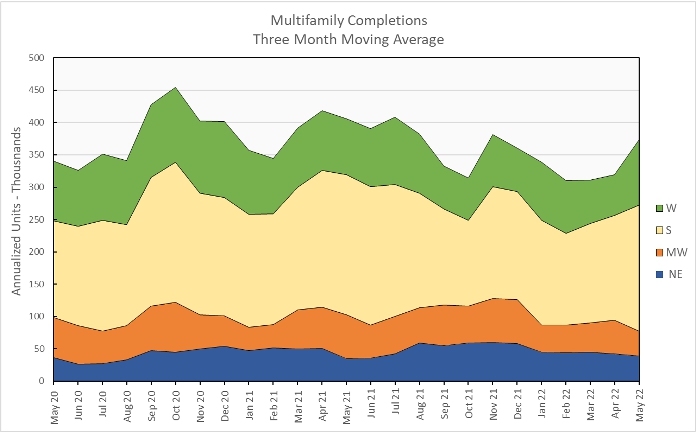
For the country as-a-whole, multifamily housing construction completions (two or more units per building) were up 17 percent month-over-month, comparing three-month weighted moving averages. The three-month weighted moving average of completions was up 58 percent in the West and 20 percent in the South. Completions were down 8 percent in the Northeast and 25 percent in the Midwest. The South region accounted for 52 percent of all completions.
On a year-over-year basis, the three-month weighted moving average of completions in buildings with 2 or more units per building was down 8 percent nationally. Completions were up 16 percent in the West and 12 percent in the Northeast but fell 10 percent in the South and 43 percent in the Midwest.
The three-month weighted moving average of completions by region for the past 25 months is shown in the chart below.
As the number of unit starts continues to outpace the number of unit completions, the number of units under construction rises. In May, Census reported that there were 828,000 units under construction in buildings with 5 or more units per building on a seasonally adjusted annualized basis. This is up by 4,000 units from the revised (+13,000 units) level of the month before. It is 24 percent, or 162,000 units, higher than the number of units under construction one year earlier. It is also once again the highest number of multifamily units under construction since February 1974.
All data quoted are based on seasonally adjusted results and are subject to revision.


