

A new report from MSCI said that multifamily property prices rose 23.3 percent year-over-year in May and that they rose 1.5 percent from the month before. The annual rate of increase is effectively unchanged from last month’s record increase.
Defining CPPI
MSCI tracks an index they call the Commercial Property Price Index (CPPI). The index is computed based on the resale prices of properties whose earlier sales prices and sales dates are known. The index represents the relative change in the price of property over time rather than its absolute price. Note that, as properties are added to the MSCI dataset each month, they recalculate the CPPI all the way back to the beginning of the data series.
Price growth varies by property class
Price appreciation in May for all commercial property as a single asset class was 18.6 percent year-over-year, up from the levels in recent months. Prices for all commercial property as a single asset class rose by 1.1 percent from the level of the previous month. In addition, updates to the data turned last month’s reported decline in this index into a gain.
Prices rose year-over-year for all property types. Even office properties, which had been the commercial property laggards, experienced double digit year-over-year price appreciation. The CPPI for offices within central business districts was up 0.9 percent for the month and 13.4 percent for the year while the CPPI for retail properties was up 1.0 percent for the month and 18.8 percent for the year.
Price appreciation for industrial properties was 1.8 percent for the month and 28.6 percent over the past 12 months, by far the highest rates of any commercial property type covered.
The poorest performing commercial property class this month was suburban offices. The price index for these properties rose 0.6 percent for the month and 10.5 percent for the year.
Tracking price appreciation
The first chart, below, plots the year-over-year changes in the values of the CPPI since January 2012 for all commercial property as a single asset class and for apartments. The chart shows that the recent price change rate for commercial property as-a-whole has leveled out after a recent decline. In this month’s data, the rate of apartment price growth seems to have crested, again. However, for several months, the rate of apartment price growth has seemed to reach a crest, only to find that with the next month’s data release, that the price growth is again seeming to crest. Only time will tell whether the apparent crest in May is really a peak in price growth.
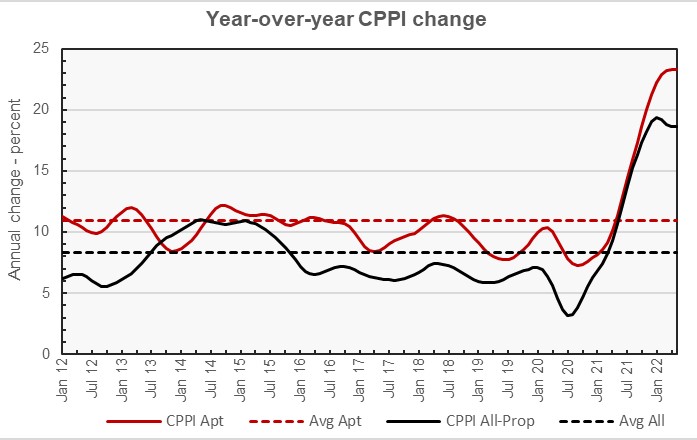
The chart also shows the average rates of annual appreciation in the indexes for the two property classes. The average annual appreciation for apartments since January 2012 is 11.0 percent, while the average annual appreciation rate for all commercial property as a single asset class is 8.4 percent.
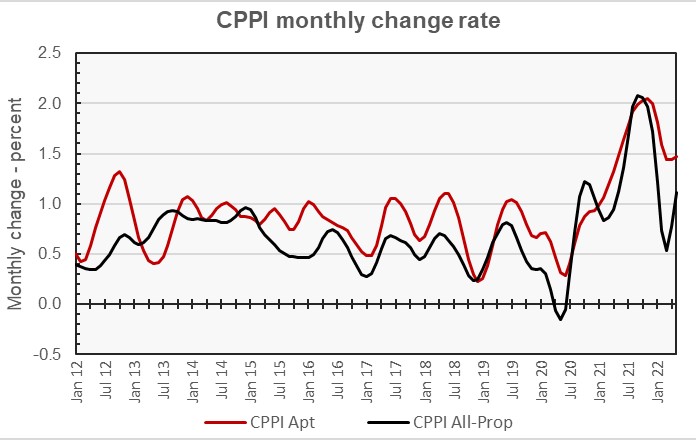
The next chart, below, plots the month-over-month change in the value of the CPPI since January 2012 for all commercial property as a single asset class and for apartments. The chart shows that the monthly rates of increases for multifamily property prices and for commercial property prices reached a peak in the fall of 2021 and fell in early 2022. Recently the rates of change for both property types have turned positive. Both the decline and the rebound for commercial property prices are sharper than those for multifamily property prices.
Major metros lag
The MSCI report provides data comparing the price changes of commercial property in 6 major metro areas* against those in the rest of the country, although it does not separate out apartments from other commercial property types in this comparison. The next chart, below, plots the history of the month-over-month change in the price indexes for the two types of property markets since January 2014.
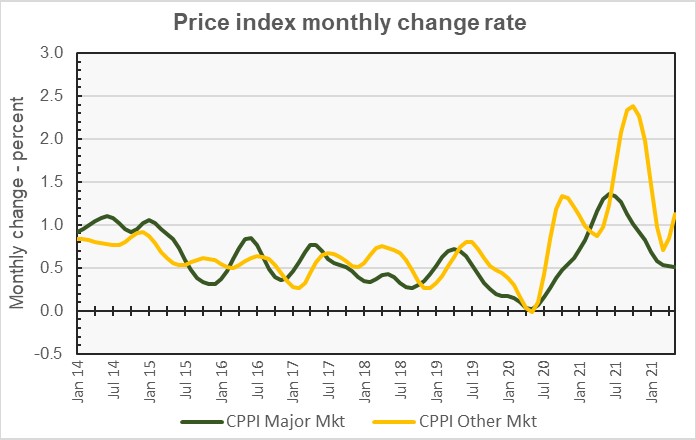
The chart shows that the average monthly price appreciation of commercial property in non-major metros has generally outpaced that in major metros since the middle of 2019.
By the numbers, commercial property price appreciation in major markets was reported to be 0.5 percent for the month and 11.2 percent for the year. Price appreciation for commercial property in non-major markets was reported to be up 1.1 percent month-over-month. Price appreciation in non-major markets for the year was 20.8 percent.
The full report provides more detail on other commercial property types. Access to the MSCI report can be obtained here.
*The major metros are Boston, Chicago, Los Angeles, New York, San Francisco and Washington DC.


