

The wage data the Bureau of Labor Statistics (BLS) released along with its employment situation report show that hourly wage growth for three categories of employees of interest to multifamily owners and operators has been falling in real terms recently in the face of rising inflation.
The data examined here is for non-supervisory employees and is seasonally adjusted. The most recent data is for May 2022.
Setting the scene
The first chart, below, shows the 20+ year history of the average hourly earnings of three categories of employees. They are lessors of residential buildings, residential property managers and residential building construction workers.
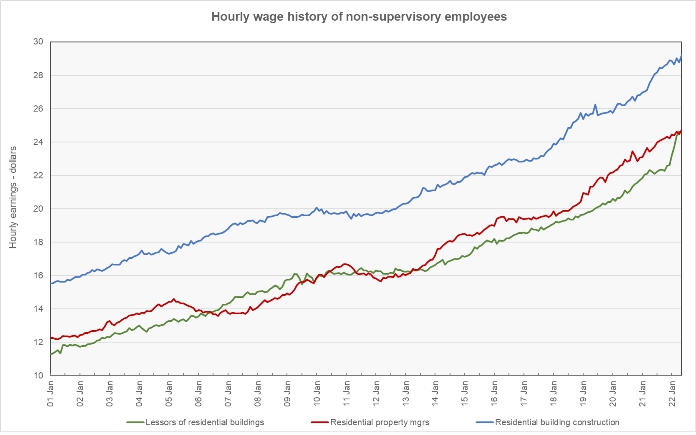
The chart shows that wage growth stalled between 2009 and 2012 as the economy recovered from the housing bust. However, the clear trend over the time span illustrated is for wages to increase, although at varying rates.
The average hourly wage for lessors of residential buildings in May 2022 was $24.63. The average wage for residential property managers was $24.72, while the average wage for residential building construction workers was $29.18.
The year-over-rate of wage growth for residential property managers was 4.9 percent while that for residential building construction workers was 5.0 percent. The rate of year-over-year wage growth for lessors of residential buildings was a surprisingly high 10.8 percent. The chart seems to indicate that the wages for this employment category may have surged recently in order to close the gap that had opened up between these wages and those of related category of residential property managers.
Zooming in
The next chart, below, presents the wage growth data since January 2018 in a different manner. It normalizes the wage level for each of the job categories to a value of 100 in January 2018 and shows the relative wage growth in each job category since then. The chart also shows the relative growth in the consumer price index (CPI) since January 2018.
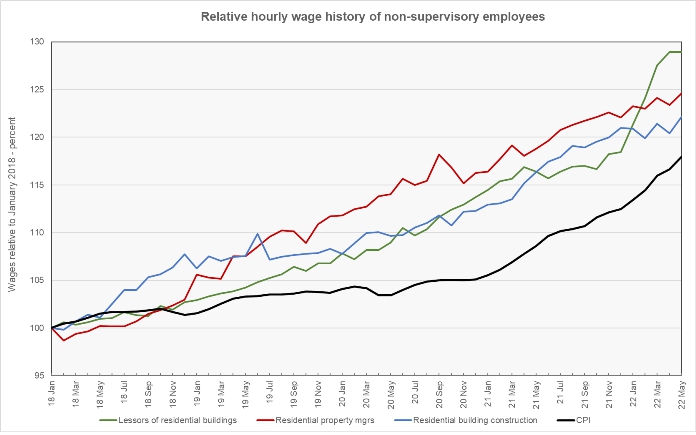
The chart shows that the hourly wages for the three job categories have generally moved higher together. At various times, each of the job categories has been the wage growth leader and at other times, each of the job categories has been the wage growth laggard. Since 2018, the wage growth in all three categories has exceeded the rise in the CPI, so wages have grown in real terms. However, the recent acceleration in the rate of increase in the CPI may be putting these gains at risk.
The final chart attempts to illustrate the real (after inflation) rate of wage growth. It does this by calculating the year-over-year wage growth based on the three-month weighted moving average of wages and then subtracting the year-over-year growth in the CPI from them.
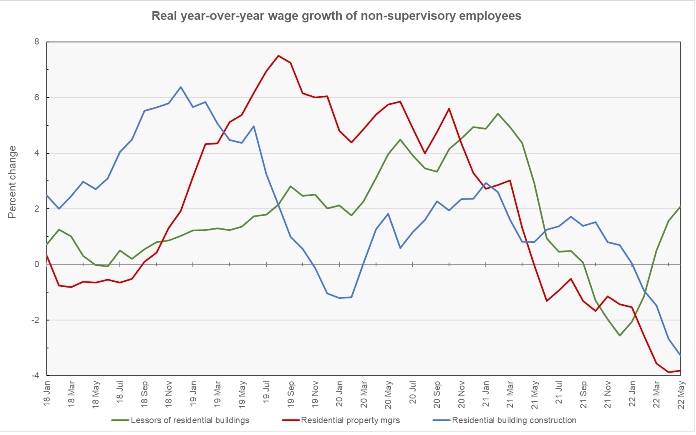
The chart shows that the inflation surge that began in May 2021 put downward pressure on real multifamily wage growth. By February 2022, real year-over-year wage growth was negative for all three jobs categories. While the recent wage surge for lessors of residential buildings has made its wage growth positive again, wage growth for this jobs category also flattened in May, so its time in the plus category may be limited.
The latest wage data is available here.


