

The Census Bureau’s latest report on construction spending shows that the value of residential construction put in place in May was up 0.2 percent from the revised level of the month before. Residential construction spending was up 19.0 percent year-over-year.
Improvements account for higher spending
The Census Bureau periodically updates its seasonal adjustment factors. In this month’s residential construction spending report, the seasonally adjusted data was revised back to January 2015. However, changes to the previous month’s data due to updates to the measurements are not reported separately from changes due to revisions in the seasonal adjustment factors. Therefore, changes to the values reported for earlier months will not be discussed in this report since their cause is unknown.
The reported value of total private residential construction put in place in May 2022 was $938.2 billion on a seasonally adjusted, annualized basis. This figure, which includes spending on both new construction and on improvements, was reported to be up $2.3 billion from April’s revised figure.
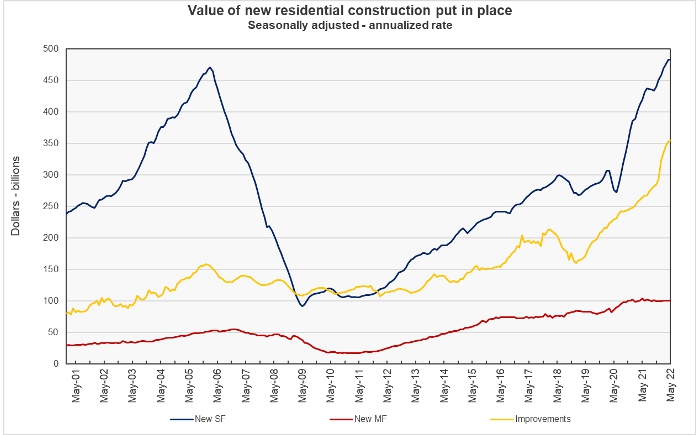
The value of new private construction of multifamily residential buildings put in place in May was reported to be $100.3 billion on a seasonally adjusted, annualized basis. This was reported to be down $28 million (0.03 percent) from the revised level for April. The value of multifamily construction spending in May 2022 was 3.6 percent lower than the level of May 2021.
State and local governments were reported to have put $9.1 billion in residential construction in place in May on a seasonally adjusted annualized basis.
The value of new single-family residential construction put in place in May was $483.1 billion on a seasonally adjusted, annualized basis. This was up fractionally from the revised level for April and was up 15.1 percent from the level of May 2021.
The value of improvements to residential buildings put in place in May was reported to be $354.9 billion on a seasonally adjusted, annualized basis. This was up 34.2 percent from the year-earlier level and was up 0.6 percent from the revised level for April. The Census Bureau does not separate out improvements for single-family and multifamily residential buildings.
Charting the data
The first chart, below, shows the history of new private residential construction spending since January 2000 for single-family housing, multifamily housing and residential improvements. It illustrates the levels of spending in each of the residential construction categories over time. It shows that multifamily residential spending is by far the smallest of the three categories.
The next chart shows the value of residential construction put in place each month relative to its level in January 2016. This chart allows the recent rates of change in the values of the three categories of residential construction to be compared.
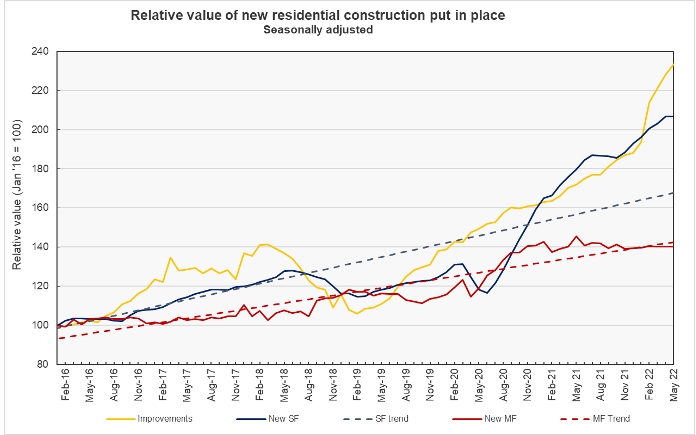
The trend line shown for single-family residential construction spending is based on the relatively constant rate of increase in this spending between late 2013 and mid-2018. The chart makes clear that the value of single-family residential construction put in place fell well below this trend between August 2018 and October 2020. However, since then, single-family residential construction spending has significantly exceeded the earlier trend.
For multifamily residential spending, the rate of growth since 2012 has not been as constant as for single-family. Therefore, the trend line shown in the graph is for the period illustrated in the chart. It shows that value of multifamily residential construction put in place has now fallen below the recent trend after exceeding it for much of the pandemic period.
The report from the Census Bureau also includes information on spending on other types of construction projects. The full report can be found here.


