

The latest commercial property price report from MSCI (formerly Real Capital Analytics) said that multifamily property prices rose 23.7 percent year-over-year in June and that they rose 1.6 percent from the month before. Both rates of increase are up from those initially posted for last month. However, updates to last month’s data resulted in its reported annual rate of increase being the highest seen in the MSCI data set, which goes back more than 20 years. June’s year-over-year rate of increase is only fractionally lower.
Defining CPPI
MSCI tracks an index called the Commercial Property Price Index (CPPI). The index is computed based on the resale prices of properties whose earlier sales prices and sales dates are known. The index represents the relative change in the price of property over time rather than its absolute price. Note that, as properties are added to the MSCI dataset each month, they recalculate the CPPI all the way back to the beginning of the data series.
Price growth positive across property classes
Price appreciation in June for all commercial property as a single asset class was 18.5 percent year-over-year, down slightly from the levels in recent months. Prices for all commercial property as a single asset class rose by 1.3 percent from the level of the previous month.
Price appreciation for industrial properties was 1.5 percent for the month and 26.9 percent over the past 12 months. The year-over-year rate of increase is once again the highest of any commercial property type covered.
The poorest performing CPPI sector, that for offices within central business districts, was unchanged for the month and up only 7.6 percent for the year. The CPPI for retail properties, another sector that struggled during the pandemic, was up 1.4 percent for the month and 18.8 percent for the year.
Tracking price appreciation
The first chart, below, plots the year-over-year changes in the values of the CPPIs since January 2012 for all commercial property as a single asset class and for apartments. The chart shows that the rate of apartment price growth has seemingly crested, although the data says that the decline in the rate of increase in the index is only nominal at this point. The chart also shows that the year-over-year price growth for all commercial property as a single asset class is declining only slowly from the peak rate it reached in January.
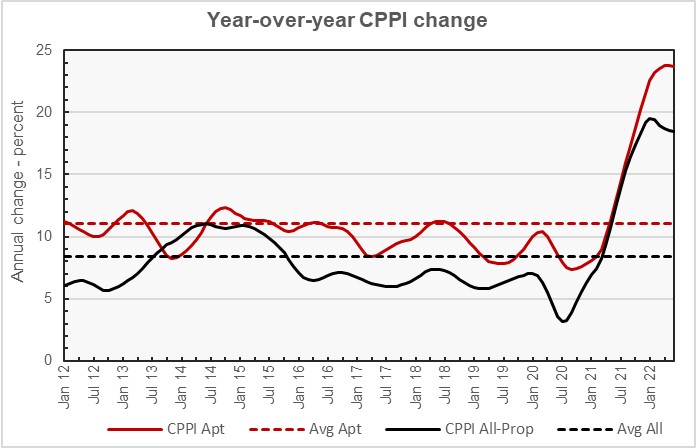
The chart also shows the average rates of annual appreciation in the indexes for the two property classes. The average annual appreciation for multifamily property prices since January 2012 is 11.1 percent, while the average annual appreciation rate for all commercial property as a single asset class is 8.4 percent.
The next chart, below, plots the month-over-month change in the value of the CPPI since January 2012 for all commercial property as a single asset class and for apartments. The chart shows that the monthly rates of increases in the CPPI for both asset classes have rebounded after reaching recent lows in March.
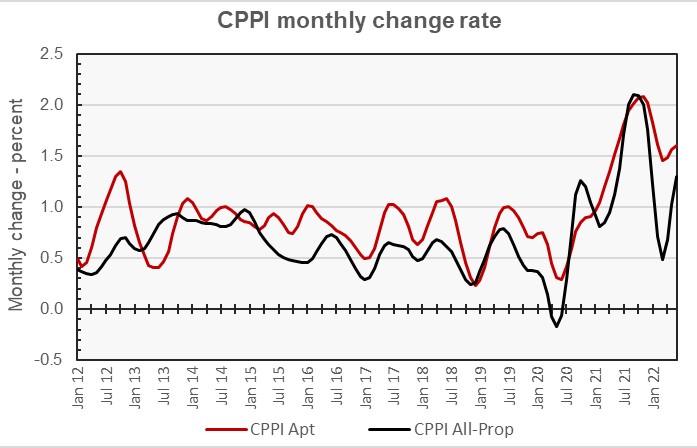
If the current monthly rates of increases for these two asset classes were sustained for 12 months, it would result in annual rates of increase of 21.0 percent for multifamily property prices and of 16.7 percent for all commercial property as a single asset class. These rates are slightly below the actual current year-over-year rates of increase.
The cities with the highest rates of price appreciation for apartment buildings were Phoenix, Miami and Raleigh/Durham. The cities with the lowest rates of price appreciation were San Francisco, San Jose and Chicago.
Major metros lag
The MSCI report provides data comparing the price changes of commercial property in 6 major metro areas* against those in the rest of the country, although it does not separate out apartments from other commercial property types in this comparison. The next chart, below, plots the history of the year-over-year change in the price indexes for the two types of property markets since January 2012.
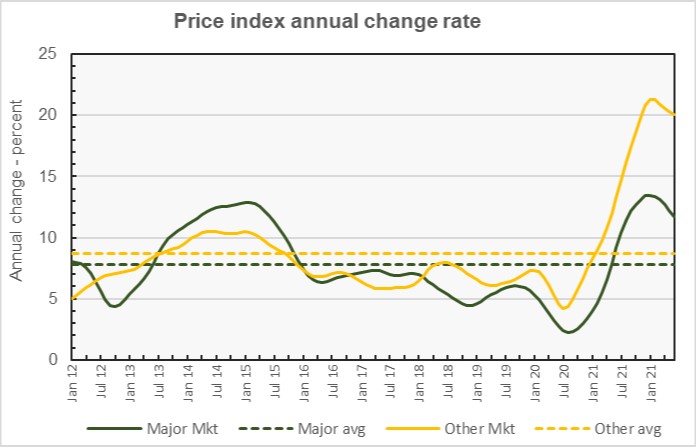
The chart shows that the average yearly price appreciation of commercial property in major metros generally outpaced that in non-major metros from January 2012 until about January 2018. Since then, price appreciation in non-major metros has been higher, giving the non-major metros the lead in price appreciation overall for the timespan shown. Rates of price appreciation for both geographies are down from their recent highs in January.
By the numbers, price appreciation for commercial property in major markets was reported to be 0.9 percent for the month and 11.7 percent for the year. Price appreciation for commercial property in non-major markets was reported to be up 1.1 percent month-over-month and 20.1 percent year-over-year.
The full report provides more detail on other commercial property types. Access to the MSCI report can be obtained here.
*The major metros are Boston, Chicago, Los Angeles, New York, San Francisco and Washington DC.


