

The Census Bureau’s report on construction spending shows that the value of residential construction put in place in June was down 1.7 percent from the revised level of the month before. Residential construction spending was up 15.6 percent year-over-year.
Single-family leads spending down
The reported value of total private residential construction put in place in June 2022 was $923.7 billion on a seasonally adjusted, annualized basis. This figure, which includes spending on both new construction and on improvements, was reported to be down $14.9 billion from May’s revised figure.
The value of new private construction of multifamily residential buildings put in place in June was reported to be $100.6 billion on a seasonally adjusted, annualized basis. This was reported to be up $414 million (0.41 percent) from the revised level for May. The value of multifamily housing construction put in place in June 2022 was 0.1 percent lower than the level of June 2021.
State and local governments were reported to have put $9.1 billion in residential construction in place in June on a seasonally adjusted annualized basis.
The value of new single-family residential construction put in place in June was $467.5 billion on a seasonally adjusted, annualized basis. This was down 3.1 percent from the revised (-$1.9 billion) level for May but was up 8.4 percent from the level of June 2021.
The value of improvements to residential buildings put in place in June was reported to be $355.6 billion on a seasonally adjusted, annualized basis. This was up 33.0 percent from the year-earlier level but was down 0.3 percent from the revised (+$1.7 billion) level for May. Without the revision to the May figure, construction spending on improvements would have been up for the month.
The Census Bureau does not separate out improvements for single-family and multifamily residential buildings.
Charting the data
The following chart shows the value of residential construction put in place each month relative to its level in January 2016, along with trend lines for the levels of single-family and multifamily construction spending.
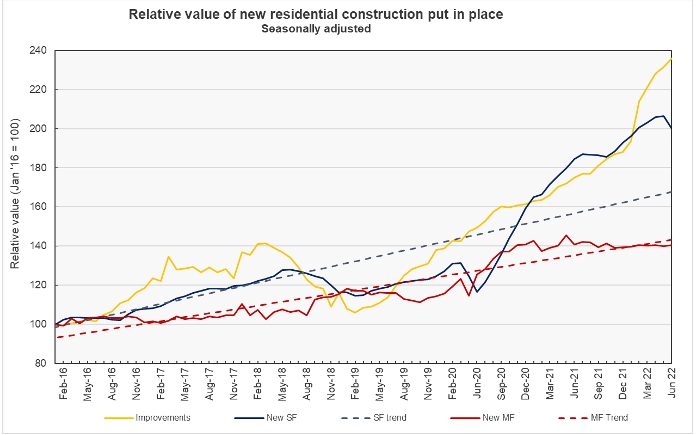
The trend line shown for single-family residential construction spending is based on the relatively constant rate of increase in this spending between late 2013 and mid-2018. The chart shows that the value of single-family construction put in place on a monthly basis had fallen below the trend line in late 2018, well before the COVID pandemic. After a brief dip at the onset of the pandemic, the value of single-family construction put in place rose rapidly and is currently well above the trend. The drop in single-family construction spending in June is the first significant decline since April 2020.
For multifamily residential spending, the rate of growth since 2012 has not been as constant as for single-family. Therefore, the trend line shown in the graph is for the period illustrated in the chart. The chart shows that the value of multifamily construction put in place monthly has been effectively flat since November 2020 at around a level of $140 million per month, annualized.
The report from the Census Bureau also includes information on spending on other types of construction projects. The full report can be found here.


