

The latest commercial property price report from MSCI (formerly Real Capital Analytics) said that multifamily property prices rose 20.9 percent year-over-year in July and that they rose 0.9 percent from the month before. Both rates of increase are down from those initially posted last month despite last month’s reported rates of price growth being revised downward.
Defining CPPI
MSCI tracks an index called the Commercial Property Price Index (CPPI). The index is computed based on the resale prices of properties whose earlier sales prices and sales dates are known. The index represents the relative change in the price of property over time rather than its absolute price. Note that, as properties are added to the MSCI dataset each month, they recalculate the CPPI all the way back to the beginning of the data series.
All property classes see gains
In July, appreciation for all commercial property prices as a single asset class was 16.8 percent year-over-year. The latest data show the year-over-year rate of growth in the price index has been declining gradually since reaching a peak of 19.9 percent in January 2022. Prices for all commercial property as a single asset class rose by 0.9 percent from the level of the previous month.
Price appreciation for industrial properties was 1.2 percent for the month and 24.4 percent over the past 12 months. Both of these rates of increase are the highest of any commercial property type covered in the report.
The poorest performing CPPI sector, that for offices within central business districts, was unchanged for the month and up 7.7 percent for the year. The CPPI for retail properties was up 1.0 percent for the month and 17.7 percent for the year.
Tracking price appreciation
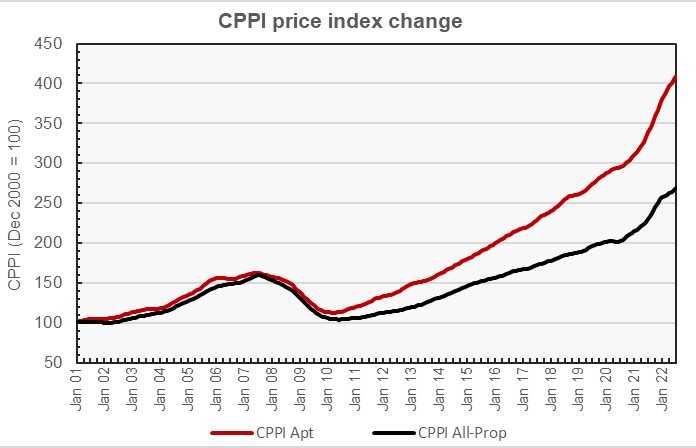
The first chart, below, plots the history of the CPPI for both apartments and for all commercial property as a single asset class since the start of the serries in 2001. While the growths in the two indexes tracked each other closely up to 2009, they have diverged since then.
The next chart plots the year-over-year changes in the values of the CPPI since January 2012 for all commercial property as a single asset class and for apartments. The chart shows that the rate of apartment price growth is declining from the peak rate in reached in March 2022, although it remains at a level well above historical norms.
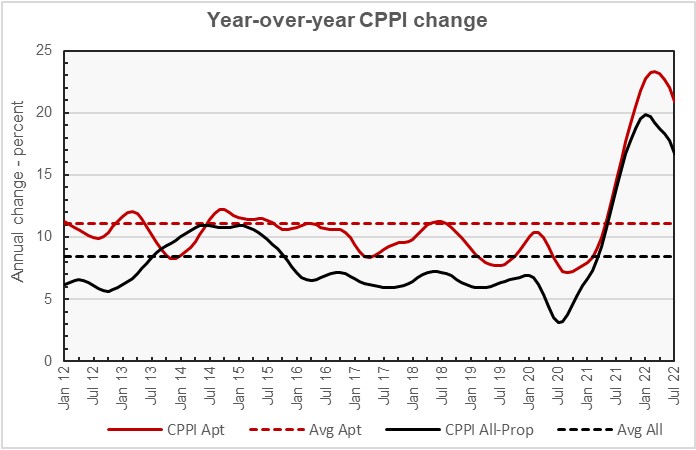
The chart also shows the average rates of annual appreciation in the indexes for the two property classes. The average annual appreciation for apartments since January 2012 is 11.1 percent, while the average annual appreciation rate for all commercial property as a single asset class is 8.5 percent.
Major metros lag
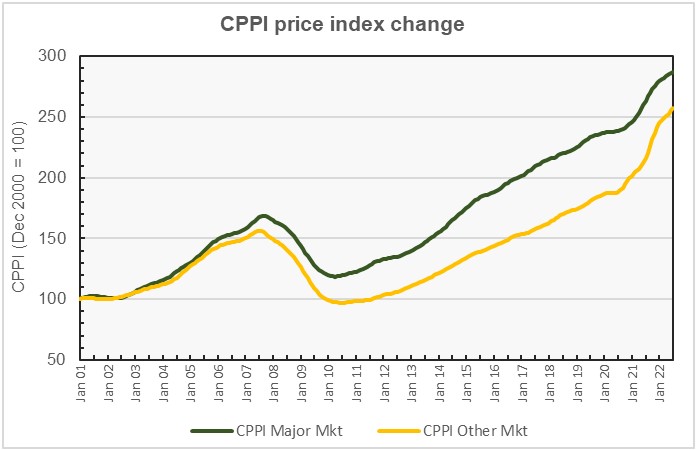
The MSCI report provides data comparing the changes in commercial property prices in 6 major metro areas* against those in the rest of the country, although it does not separate out apartments from other commercial property types in this comparison. The next chart, below, plots the history of the price indexes since the start of the data series for both market segments. It shows that prices appreciated more rapidly in the major markets between 2005 and 2019, but that the gap has closed somewhat over the last 2 years.
The final chart plots the history of the year-over-year change in the price indexes for the two property markets since January 2012. The chart shows that the average yearly appreciation in commercial property prices in major metros generally outpaced that in non-major metros from January 2012 until about January 2018. Since then, price appreciation in non-major metros has been higher, giving the non-major metros the lead in price appreciation overall for the timespan shown. Rates of price appreciation for both geographies are down from their recent highs in January but the recent decline has been more rapid for properties in the major markets than it has been for properties in the non-major markets.
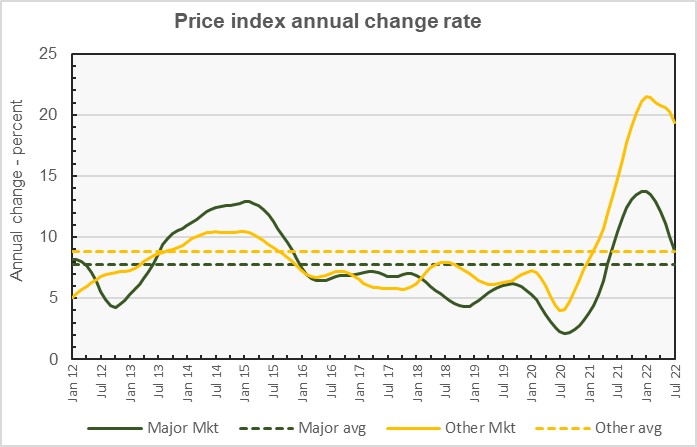
By the numbers, commercial property price appreciation in major markets was reported to be 0.3 percent for the month and 8.9 percent for the year. Commercial property price appreciation in non-major markets was reported to be up 1.0 percent month-over-month and 19.3 percent year-over-year. The average rates of price appreciation over the time period represented by the chart are 7.7 percent for major markets and 8.8 percent for non-major markets.
The full report provides more detail on other commercial property types. Access to the MSCI report can be obtained here.
*The major metros are Boston, Chicago, Los Angeles, New York, San Francisco and Washington DC.


