

A report from Trepp examined the operational and loan performance of multifamily properties in 19 Metropolitan Statistical Areas (MSAs) and found that year-over-year expense growth outpaced revenue growth in 15 of the MSAs in 2021. As a result, net operating growth (NOI) growth trailed revenue growth in all but 4 of the MSAs studied.
Tracking rent growth
Trepp ranked the 19 MSAs by their rent growth rate over the 18 months from January 2021 through June 2022. They used rent data collected by the Bureau of Labor Statistics (BLS) for use in calculating the Consumer Price Index (CPI). Trepp found that the average year-over-year rent growth rates in the MSAs varied from a high of 11 percent in the Phoenix metro area to a low of only 0.5 percent in the San Francisco metro area.
While revenue growth was correlated with rent growth, it was not a one-to-one correlation. For example, the Seattle MSA saw rent growth of 3.9 percent but saw revenue decline by 0.3 percent. By contrast, the Houston MSA saw rent growth of 3.7 percent while it saw revenue rise by 4.0 percent.
Changes in apartment occupancy rates within the various MSAs was not addressed in the Trepp report.
Viewing operational results
Trepp used their proprietary data to assess the growth in revenue and operating expenses within each MSA and the resulting change in NOI. The results for the full range of properties in each of the metro areas is summarized in the following chart. The MSAs in the chart are arranged by rent growth, with the metros on the left having the highest rent growth rates and the metros on the right having the lowest rent growth rates.
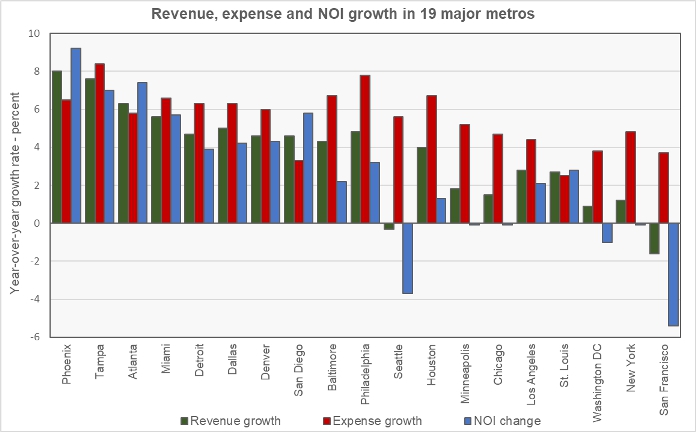
Unsurprisingly, the chart shows that generally when the revenue growth rate exceeded the expense growth rate, the NOI growth rate exceeded the revenue growth rate. An exception to this was the Miami MSA where expenses grew by 6.6 percent, revenue grew by only 5.6 percent, yet NOI grew by 5.7 percent.
Trepp also separated out properties by their relative rent levels within their markets. They looked at the 20 percent of the properties with the lowest rent levels and the 20 percent of the properties with the highest rent levels to see how their revenue, expense and NOI growth rates compared to those of the entire population of properties. The results for the low rent properties are shown in the next chart, below.
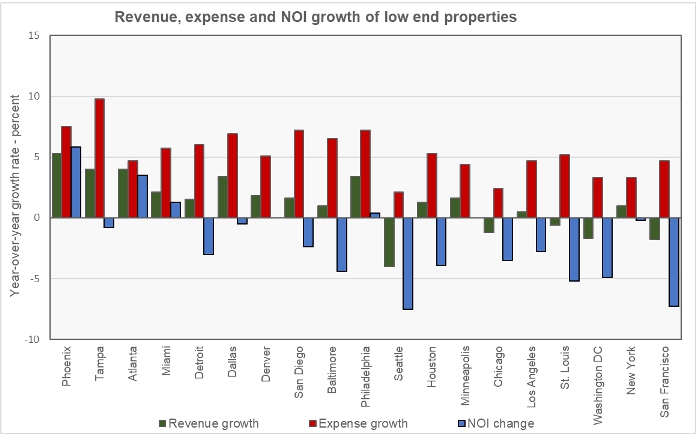
The chart shows that expense growth exceeded revenue growth for the low rent properties in all of the MSAs studied. With the exception of the Phoenix MSA, NOI growth trailed revenue growth in all of the metros. In fact, NOI growth was zero or negative in 14 of the 19 metros studied.
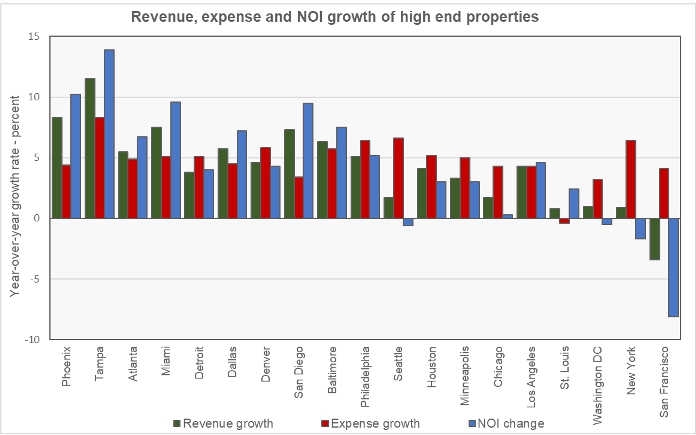
The last chart shows the same information for the properties with rents in top 20 percent in their metro. While many of these metros saw expense growth exceed revenue growth, only 4 saw NOI actually fall.
The full report also includes information on loan stress such as delinquency rates and debt service coverage ratios. It is available here.


