

Yardi Matrix reported that the national average year=over-year apartment rent growth in August was $10, bringing the average rent to $1,718 per month. However, rents fell in August from the revised level of the month before for the first time in over 2 years.
Rent growth rate slipping
The national average apartment rent was up 10.9 percent in August from its year-earlier level. This rate of increase was down 1.7 percentages point from that reported last month. This was the sixth month in succession with a declining rate of year-over-year rent growth. Still, the rate of year-over-year rent growth has now been in double digits for 13 straight months, according to Yardi Matrix.
Rents in the “lifestyle” asset class, usually Class A properties, rose 10.5 percent year-over-year, while rents in “renter by necessity” (RBN) properties increased by 11.3 percent year-over-year. The chart, below, shows the history of the year-over-year rent growth rates for these two asset classes along with the difference between these rates.
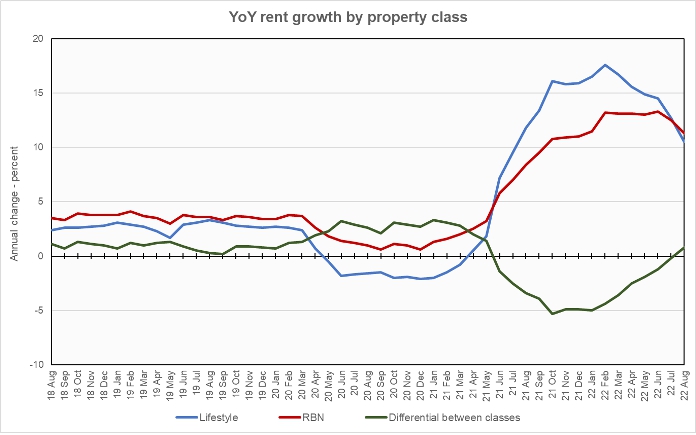
The chart shows that rents for RBN properties rose at a faster rate than did rents for lifestyle properties in August for the first time since May 2021. This return to the pre-pandemic pattern may indicate that the multifamily rental market is normalizing.
The rent figures being tracked by Yardi Matrix are asking rents for vacant units.
Yardi Matrix also reported that single-family rental (SFR) rents fell $2 during the month to $2,090 per month. The year-over-year rent growth rate fell to 9.5 percent. The national occupancy rate for single-family rentals fell 1.0 percentage points. Occupancy fell in 25 of the 34 metros tracked in the report.
Rent growth rankings
Of the top 30 metros by population, the ones with the largest annual apartment rent increases as ranked by Yardi Matrix are given in the table, below, along with their annual percentage rent changes and the annual percentage rent change recorded in last month’s report.
| Metro | YoY change % – August | YoY change % – July |
| Orlando | 16.9 | 20.2 |
| Miami Metro | 16.7 | 19.5 |
| Nashville | 14.8 | 16.5 |
| Dallas | 14.2 | 16.1 |
| Tampa | 14.0 | 17.4 |
| Orange County | 13.5 | 17.6 |
| Raleigh | 13.5 | 17.5 |
| Charlotte | 12.7 | 15.6 |
| Indianapolis | 12.5 | 13.9 |
| San Jose | 11.9 | 13.4 |
The major metros with the smallest year-over-year apartment rent growth as determined by Yardi Matrix are listed in the next table, below, along with the year-over-year rent increases for the metros.
| Metro | YoY change % – August | YoY change % – July |
| Twin Cities | 3.7 | 4.2 |
| Baltimore | 6.7 | 8.4 |
| Sacramento | 7.5 | 9.2 |
| Houston | 7.9 | 9.1 |
| Chicago | 8.0 | 9.6 |
| San Francisco | 8.5 | 9.0 |
| Washington DC | 8.7 | 10.0 |
| Kansas City | 9.6 | 10.1 |
| Los Angeles | 9.6 | 11.1 |
| Phoenix | 9.6 | 13.3 |
Declining rates of year-over-year rent growth were seen in all 30 of the major metros tracked in the Yardi Matrix report.
The top metros for month-over month rent growth in August were Philadelphia, San Francisco and Nashville. The metros with the lowest month-over-month rent growth were Raleigh, Seattle and Inland Empire. Of the 30 major metros tracked by Yardi Matrix, 22 saw negative month-over-month rent growth in August, up from only 5 that saw rents fall last month.
Population drives housing
The discussion part of the report focused on the declining rate of population growth in the United States and its impact on housing demand. While both the birthrate and the rate of foreign in-migration for the country as-a-whole have declined recently, housing demand has remained strong in many regions due people moving about the country. In addition, household formation has been high because the many good jobs available allow more people to afford to live on their own. So, while slowing population growth is a challenge for housing in the long term, in the short term, demand remains high.
SFR market also softens
Yardi Matrix also reported on the top 34 metros for single family rentals. This month, 33 of the 34 metros covered saw positive year-over-year rent growth, with Atlanta being the only exception. The leading metros for year-over-year rent growth were Washington D.C., Orlando and Toledo. SFR rents were up 40 percent from year-earlier levels in both Washington D.C. and Orlando.
This month, 25 of the metros saw year-over-year declines in occupancy, up 1 from last month. The leading metros for year-over-year SFR occupancy growth were Philadelphia, Houston and Lansing. Las Vegas, Tampa and Sacramento saw the greatest SFR occupancy declines.
The complete Yardi Matrix report provides information on some of the smaller multifamily housing markets. It also has more information about the larger multifamily markets including numbers on job growth and completions of new units. It includes charts showing the history of rent changes in 18 of the top 30 markets over the last 4 years. It can be found here.


