

The latest commercial property price report from MSCI Real Capital Analytics said that multifamily property prices rose 17.1 percent year-over-year in August and that they rose 0.1 percent from the month before. Both rates of increase are down from those initially posted last month despite the that month’s reported rates of price growth being revised lower.
Defining CPPI
MSCI tracks an index called the Commercial Property Price Index (CPPI). The index is computed based on the resale prices of properties whose earlier sales prices and sales dates are known. The index represents the relative change in the price of property over time rather than its absolute price. Note that, as properties are added to the MSCI dataset each month, they recalculate the CPPI all the way back to the beginning of the data series.
All property classes see growth
Price appreciation in August for all commercial property as a single asset class was 14.0 percent year-over-year, continuing the trend of falling rates of price appreciation that has been in place since January. Prices for all commercial property as a single asset class rose by 0.4 percent from the level of the previous month.
Price appreciation for industrial properties was 1.4 percent for the month and 24.7 percent over the past 12 months. Both of these rates of increase are up from those initially reported last month and are the highest of any commercial property type covered in the report.
The poorest performing CPPI on a year-over-year basis was that for suburban offices. This index was up 0.2 percent for the month but up only 6.6 percent for the year. The CPPI for retail properties was up 0.8 percent for the month and 16.0 percent for the year.
Price appreciation slows
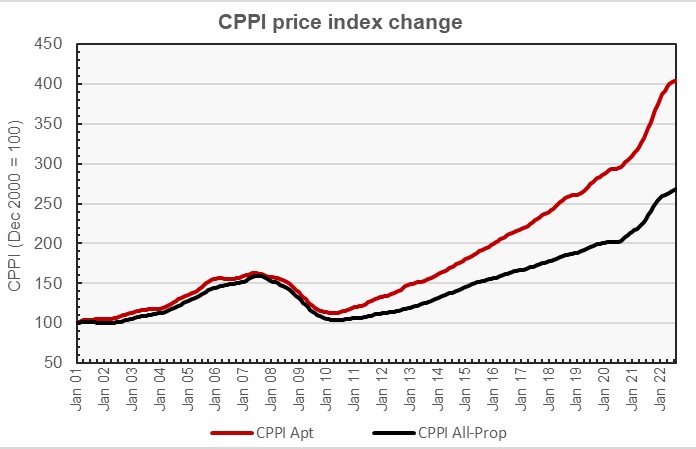
The first chart, below, plots the history of the CPPI for both apartments and for all commercial property as a single asset class since the start of the series in 2001. It shows that multifamily property price appreciation has outpaced that of all commercial property as a single asset class since the recovery from the housing bust of 2007 began.
The next chart plots the year-over-year changes in the values of the CPPI since January 2012 for all commercial property as a single asset class and for apartments. The chart shows that the year-over-year rates of price growth for both of these commercial property classes are down from their recent highs but are still well above their long-term averages.
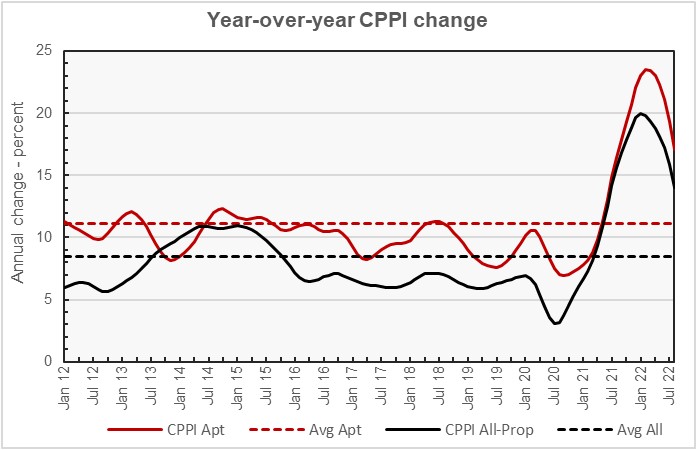
The chart also shows the average rates of annual appreciation in the indexes for the two property classes. The average annual multifamily property price appreciation rate since January 2012 is 11.1 percent, while the average annual appreciation rate for all commercial property as a single asset class is 8.5 percent.
Major metros lag
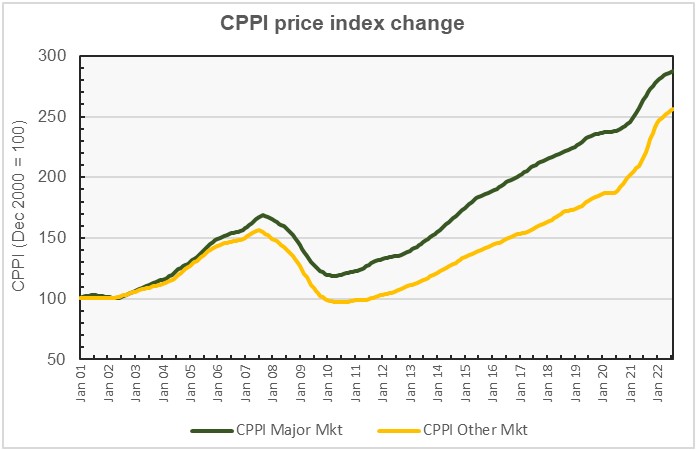
The MSCI report provides data comparing the price changes of commercial property in 6 major metro areas* against those in the rest of the country, although it does not separate out apartment prices from those of other commercial property types in this comparison. The next chart, below, plots the history of the price indexes since the start of the data series for both market segments. It shows that the price index in major markets had grown to be as much as 33 percent higher than that in secondary markets as recently as 2017. However, this spread has been falling since then and is down to only 12 percent in the latest report.
The final chart plots the history of the year-over-year change in the price indexes for the two property markets since January 2012. The chart shows that non-major markets have had a higher rate of year-over-year price appreciation since early 2018 and that this lead grew as the recovery from the pandemic proceeded. While the rates of year-over-year price appreciation for both market segments have fallen recently, that of major markets is now back to its long-term average while that for non-major markets is still nearly twice its long-term average.
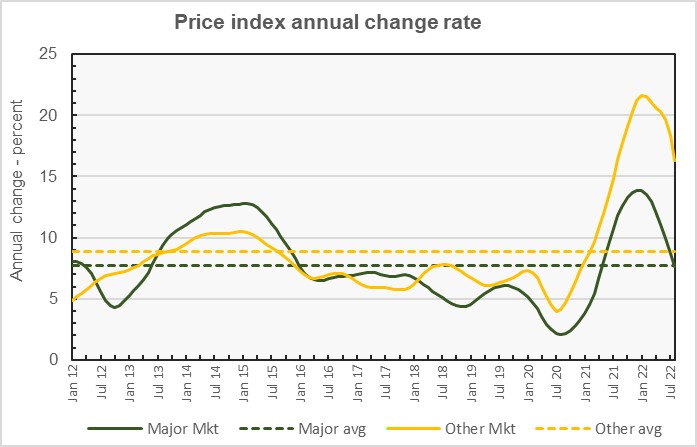
By the numbers, price appreciation for commercial property in major markets was reported to be 0.2 percent for the month and 7.6 percent for the year. Price appreciation for commercial property in non-major markets was reported to be up 0.4 percent month-over-month and 16.3 percent year-over-year. The average rates of price appreciation over the time period represented by the chart are 7.7 percent for major markets and 8.8 percent for non-major markets.
The full report provides more detail on other commercial property types. Access to the MSCI report can be obtained here.
*The major metros are Boston, Chicago, Los Angeles, New York, San Francisco and Washington DC.


