

CoStar reported that its value-weighted index of multifamily property prices increased 14.5 percent, year-over-year, in September 2022. However, this index was down 0.2 percent month-over-month, the third monthly decline in a row.
The value-weighted index of non-multifamily commercial property rose by 5.3 percent, year-over-year, in September. This index rose 1.4 percent month-over-month. The other commercial property types tracked by CoStar are office, retail, industrial and hospitality.
For more information on the CoStar Commercial Repeat Sales Indexes (CCRSI’s), please see the section at the bottom of this report.
Comparing property types
The first chart, below, shows the history of the value-weighted CCRSI’s since January 2012 for multifamily property and for all other commercial property considered as a single asset class. It also shows trend lines for the growth in the two CCRSI’s based on their growth in the period from January 2012 to January 2020. The indexes are normalized so that their values in December 2000 are set to 100.
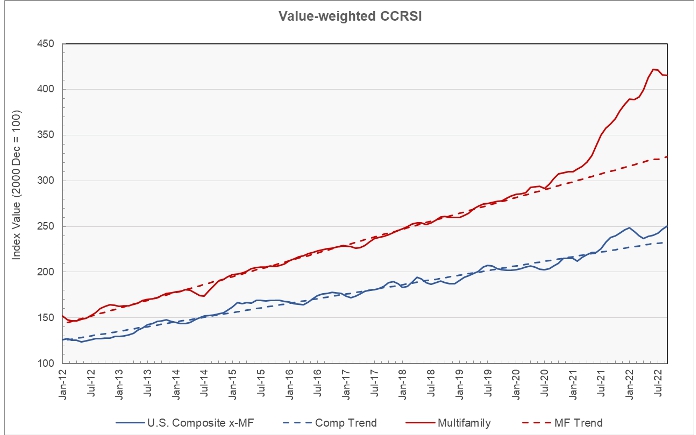
The chart shows that the two indexes closely tracked their trend lines until early 2020. However, by September 2022, the multifamily CCRSI was 27.2 percent above the trend line, although this was down from the peak deviation of 30.4 percent reached in May. The CCRSI for non-multifamily commercial property was 7.4 percent above its trend line in September.
The second chart shows the year-over-year change in the value-weighted multifamily property price index and that for all other commercial property types since January 2012. It also shows the average rates of annual price growth for the two property classes over that time.
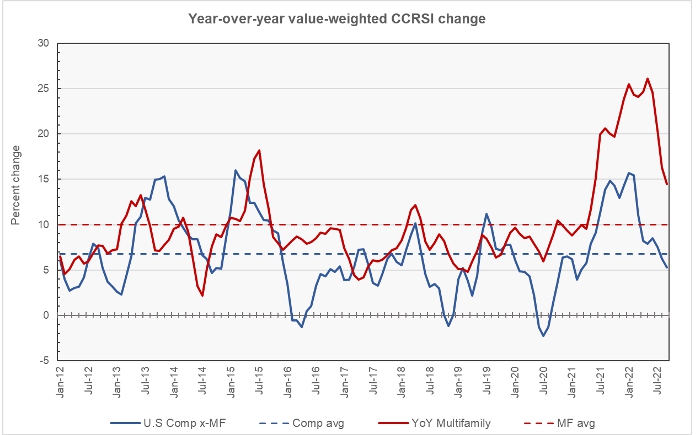
The chart shows that the year-over-year rate of increase in multifamily property prices has been in double digits since May 2021 and reached a high of 26.1 percent in May 2022. The year-over-year rate of increase for other commercial property prices has been trending downward during 2022 after peaking at 15.7 percent in January.
The average annual increase in multifamily property prices has been 9.8 percent while that of other commercial property prices has been 6.8 percent. For comparison, MSCI Real Capital Analytics reports that the average annual increase in multifamily property prices has been 11.1 percent while that of other commercial property has been 8.5 percent.
Viewing regional differences
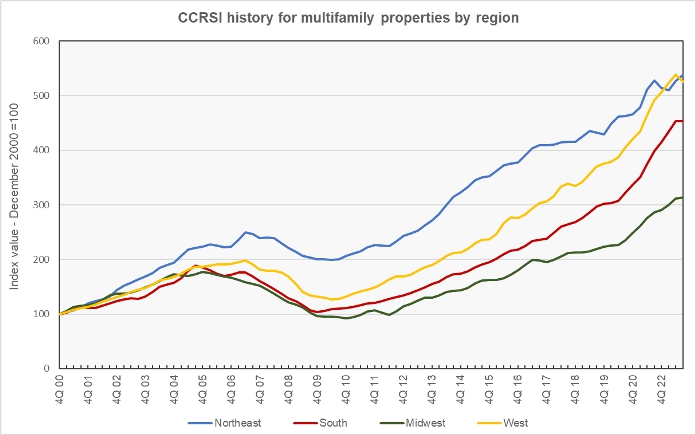
CoStar’s quarterly reports include information on the change in the equal-weighted CCRSI by region. The long-term history of these indexes is shown in the next chart, below. The chart shows that, between 2000 and 2010, multifamily property prices grew much more rapidly in the Northeast than in the other regions of the country. However, since about 2017, price appreciation in the Northeast has lagged to the point that price appreciation in the West region has caught up.
The final chart shows the history of the year-over-year multifamily property price changes since 2014. The chart shows that the post-COVID price surge that began in Q4 2020 reached the highest level for the longest time in the South region. It was least pronounced in the Northeast, accounting for the recent lag in Northeast region property price appreciation.
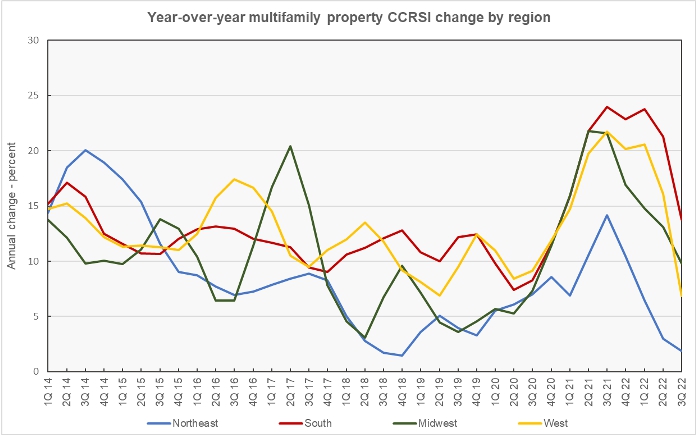
Based on CoStar’s equal-weighted quarterly indexes and comparing to year-earlier levels, prices in Q3 2022 were up by 13.8 percent in the South, 9.8 percent in the West, 6.8 percent in the Midwest and 1.9 percent in the Northeast.
Transaction volumes down again
An issue with monthly transaction volume reporting is that CoStar usually identifies additional transactions to tabulate over the next few months after the initial report, and these transactions can have a large influence on the results. For example, the latest report identified an additional 182 transactions for August not reported last month but only 47 new transactions for July. Therefore, the 9.3 percent drop in the number of transactions between July and August reported last month was revised to a drop of only 1.7 percent in the latest report.
Keeping in mind that initial reports may overstate declines in activity and understate rises in activity, the preliminary number of transactions reported for September was down 21.2 percent from the revised level of the month before. The preliminary dollar volume of transactions was also down, falling 20.8 percent.
The full report discusses all commercial property types. While the CoStar report provides information on transaction volumes, it does not break out multifamily transactions. The latest CoStar report can be found here.
CCRSI defined
The CoStar report focuses on a relative measure of property prices called the CoStar Commercial Repeat Sales Index (CCRSI). The index is computed based on the resale of properties whose earlier sales prices and sales dates are known. The index represents the relative change in the price of property over time rather than its absolute price. CoStar identified 1,420 repeat sale pairs in September for all property types. These sales pairs were used to calculate the results quoted here.
CoStar computes CCRSI’s for a variety of property groupings, combining them by cost, region, property type or other factors. The value-weighted index is more heavily influenced by transactions of expensive properties than is CoStar’s equal-weighted index. The value-weighted index is the focus of this report because it is an index whose value is reported monthly and for which CoStar breaks out multifamily property as a separate category.


